

Forget the basics—these moving average tools go beyond the standard EMA and SMA. Learn how pro traders are using advanced moving averages on TradingView to get clearer entries, better exits, and stronger confirmation signals.
📘 Table of Contents
- What is a Moving Average in Trading?
- Why Use a Moving Average?
- Which Moving Average is Best?
- 50-day vs. 200-day Moving Average
- How to Use a Moving Average to Buy Stocks
- 5 Advanced Moving Averages You Must Try on TradingView
- Conclusion
- FAQ
What is a Moving Average in Trading?
A moving average (MA) is a simple yet powerful indicator used to smooth out price data over time. By calculating the average price over a selected period (e.g., 10 days, 50 days), it helps traders filter out market noise and better understand the trend direction.
There are several types of moving averages:

- Simple Moving Average (SMA)
- Exponential Moving Average (EMA)
- Weighted Moving Average (WMA)
- Volume-Weighted Moving Average (VWMA)
- Hull Moving Average (HMA)
Each one differs slightly in how it reacts to recent price changes.
Why Use a Moving Average?
Moving averages help traders:
- Identify trend direction (bullish, bearish, or ranging)
- Spot potential entry/exit points
- Detect crossovers as momentum signals
- Serve as support/resistance zones
- Smoothen price action for better clarity
Which Moving Average is Best?
There is no “one-size-fits-all” answer. The best moving average depends on:
- Your trading style (scalping, intraday, swing, positional)
- The timeframe you’re trading (1 min vs daily)
- Market volatility
For faster signals → try EMA or HMA
For long-term trends → go with SMA or WMA
50-Day vs 200-Day Moving Average
The 50-day MA is often used for medium-term trends. It reacts quicker to price movements and is preferred by swing and short-term traders.
The 200-day MA is a long-term trend follower. It is slower but more stable, commonly used by institutional investors.
📌 Tip: The Golden Cross (50-day crossing above 200-day) is a classic bullish signal.
The Death Cross (50-day crossing below 200-day) signals bearish trends.
How to Use a Moving Average to Buy Stocks
Here’s a simple framework:
- Identify the Trend
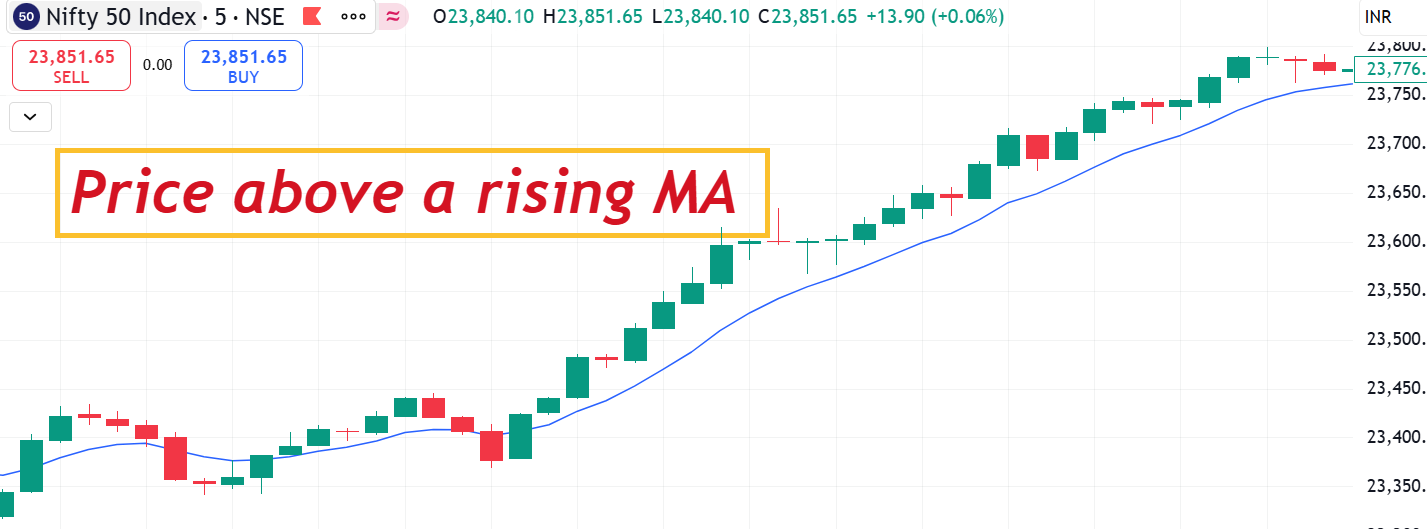 → Uptrend → Look for Buy
 - Use Crossovers for Entry Example: 8 EMA crosses above 21 EMA →
 Bullish signal
 - Confirm with Volume or Oscillator
Combine with MACD, RSI, or Volume for more confluence - Place SL/TP Zones Use the MA as dynamic support/resistance for SL/TP
5 Advanced Moving Averages You Must Try on TradingView
1. ✅ Moving Average Shift [ChartPrime]
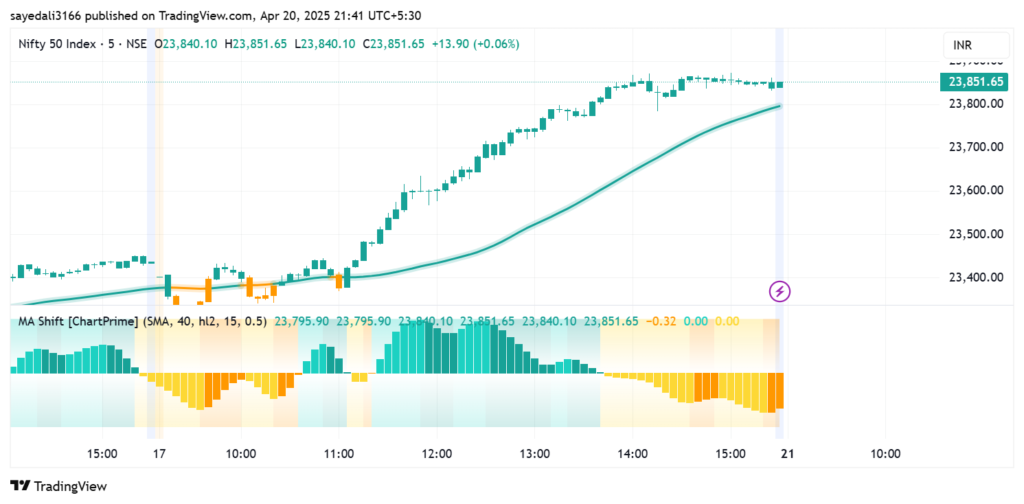
A multi-functional MA tool designed to combine trend direction and mean reversion signals in one.
🔍 Key Features:
- Select from SMA, EMA, SMMA, WMA, VWMA
- Dynamic candle coloring based on trend
- MA Shift Oscillator to detect price deviation
- Diamond Reversion Signals to indicate reversal potential
📈 How to Use:
- Trade in the direction of MA color (Green = Bullish, Red = Bearish)
- Watch oscillator color shifts for early trend signals
- Diamond signals = reversion points (ideal for mean-reversion traders)
🎯 Best for: Swing traders, mean-reversion scalpers
2. 🔄 SPY Moving Averages + Cross Signals (OptionsMillionaire)
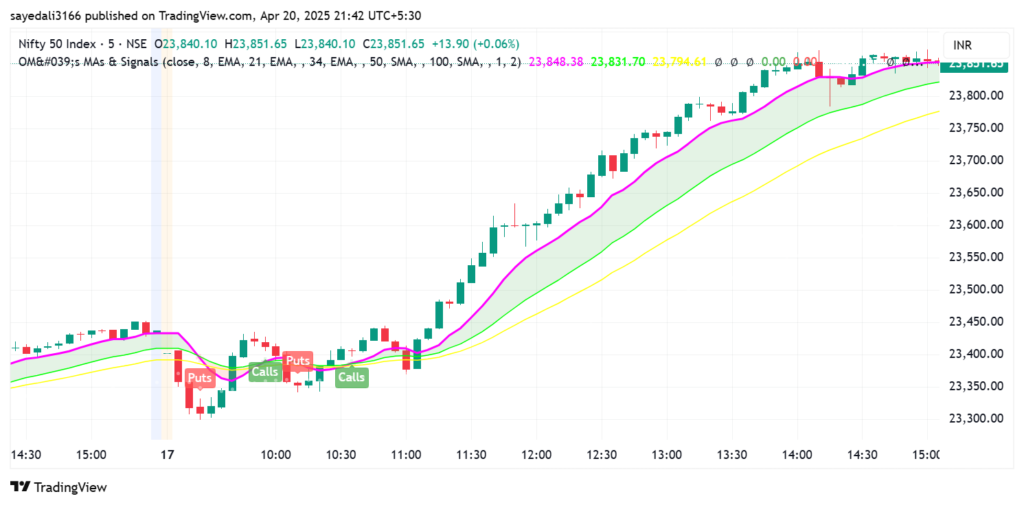
This setup is built for options trading, especially on SPY, using multiple EMAs and strict rules.
📊 Moving Averages Included:
- 8 EMA, 21 EMA, 100 SMA, 200 SMA
- MACD & RSI
- Hull Moving Average (HMA) for dynamic confirmation
💡 Strategy Highlights:
- 8/21 EMA crossover = trend change
- Price > 200 SMA = bullish trend bias
- Green HMA background = trend momentum
- Strong rule-based approach with discipline
🚦 How to Use:
- Buy calls when 8 crosses 21 from below and price is above 200 SMA
- Confirm with RSI > 50 and HMA in green
- Stick to a risk plan: 10% stop-loss, aim for 10–20% gain
🎯 Best for: SPY options traders, disciplined rule-based traders
3. 🧠 Auto-Length Moving Average + Trend Signals [Zeiierman]
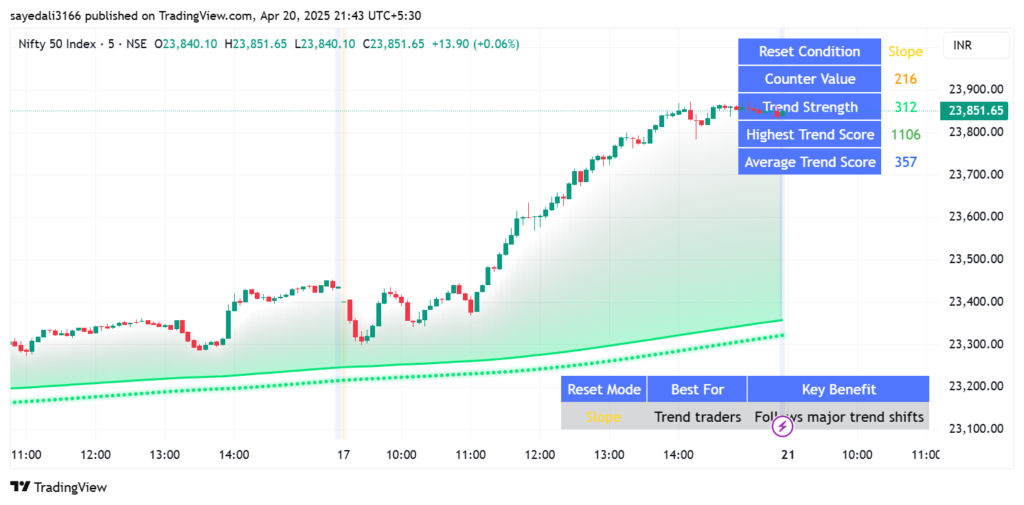
This genius indicator automatically adjusts MA length based on volatility, trend strength, and momentum.
📌 Adaptive Features:
- Expands in strong trends (for smoother signals)
- Contracts in choppy zones (for faster reactions)
- Built-in trend signals: Uptrend, Downtrend, Neutral
- Reset filters based on:
- RSI
- MACD
- Volume spikes
- Bollinger Bands
- CCI
- Momentum shifts
💡 How to Use:
- Use dynamic MA color as trend direction filter
- Combine trend strength table with RSI to confirm reversal
- Entry when signal + MA color align
🎯 Best for: Adaptive traders, swing-to-position traders, beginners looking for fewer false signals
4. ⚡ Adaptive Hull Moving Average+

An upgraded HMA that visually identifies trend strength using colors and reacts dynamically to volatility.
🎨 Color Code:
- Yellow: Consolidation (avoid)
- Light Green/Red: Weak trend
- Dark Green/Red: Strong momentum trend
⚙️ Smart Settings:
- Adjustable period (172–233 works well on 15m–1H)
- Built-in alerts for:
- Volume Break
- Volatility Meter
🛠️ Entry Strategy:
- Buy when:
- Price > MA
- MA color = Dark Green
- RSI > 50
🎯 Best for: Trend-following intraday traders and confirmation seekers
5. 🔺 Triangular Hull Moving Average + Volatility [BigBeluga]
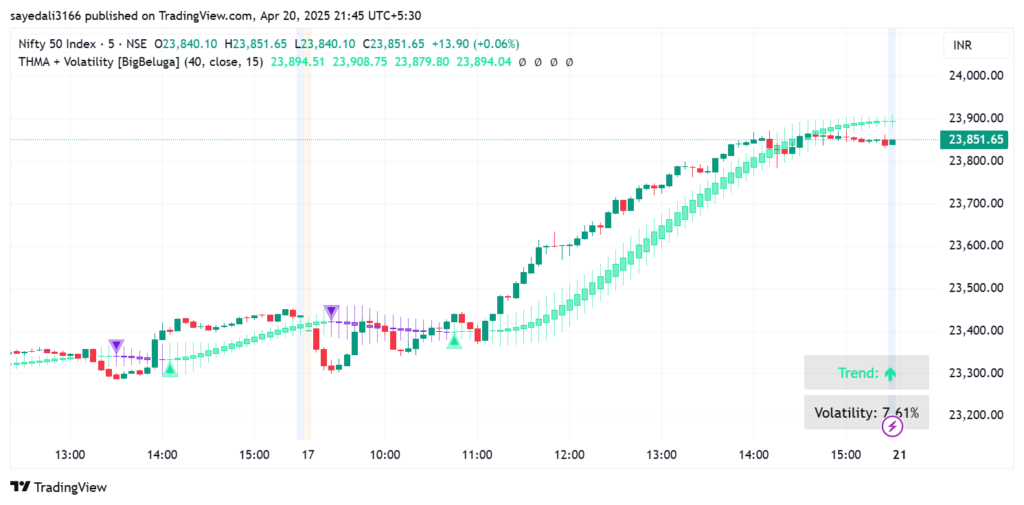
A highly visual indicator combining THMA candles, trend direction, and volatility bands.
📈 Features:
- THMA trend-based colored candles
- Volatility bands to gauge breakout potential
- Triangle signals = Trend reversal points
- Customizable dashboard showing:
- Trend direction
- Volatility percentage
💡 How to Use:
- Use triangle signal + THMA color for entry
- Confirm with expanding volatility bands
- Ideal for breakout trades or catching new swings early
🎯 Best for: Momentum breakout traders, visual learners
Conclusion
Moving averages are more than just lines on a chart. The five advanced indicators featured above combine trend detection, dynamic price behavior, and visual aids to help you trade smarter—not harder.
✅ Want a basic moving average setup? Go with the 8/21 EMA cross.
🚀 Want to go pro? Try ChartPrime’s MA Shift or Zeiierman’s Auto-Length MA.
No matter your trading style, there’s a perfect moving average strategy waiting for you on TradingView.
FAQ – Moving Averages in Trading
❓ What is the best moving average for intraday trading?
- 9 EMA, 21 EMA, and 50 SMA are popular for intraday scalping.
- Adaptive MAs like HMA or Zeiierman’s Auto-Length MA are better for filtering false signals.
❓ What timeframes work best for moving averages?
- Scalping: 1–5 min with short EMAs
- Intraday: 15m–1H
- Swing: 1H–1D
- Position: Daily–Weekly with 50/200 MAs
❓ Can I use multiple moving averages together?
Yes! Many pros use crossover systems (e.g., 8/21 EMA) combined with volume or RSI for confirmation.
❓ Which moving average is best for beginners?
Start with the 50 SMA (simple, easy to understand) or the 21 EMA (more reactive to price). As you gain experience, test advanced ones.
🔗 Want These Strategies In PDF Format?
- ✅ 25 Intraday Trading Strategies in 2025
- ✅ Options and Futures for Beginners 2025
- ✅ 15 Intraday Trading Indicators
- ✅ Stock Market for Beginners — Your complete guide to stock investing from scratch
Really educative insight despite being new to this a beginner I see myself making it.thanks wish to get more on my email.