
If you’re hunting for high-probability intraday trades, especially on the Nifty 50, this strategy might just be your next favorite. Technical analysis skills can be achieved through experience. Many of us have some favorite technical indicators. In this article, I am explaining an intraday trading strategy with the indicator “Scalping The Bull”.
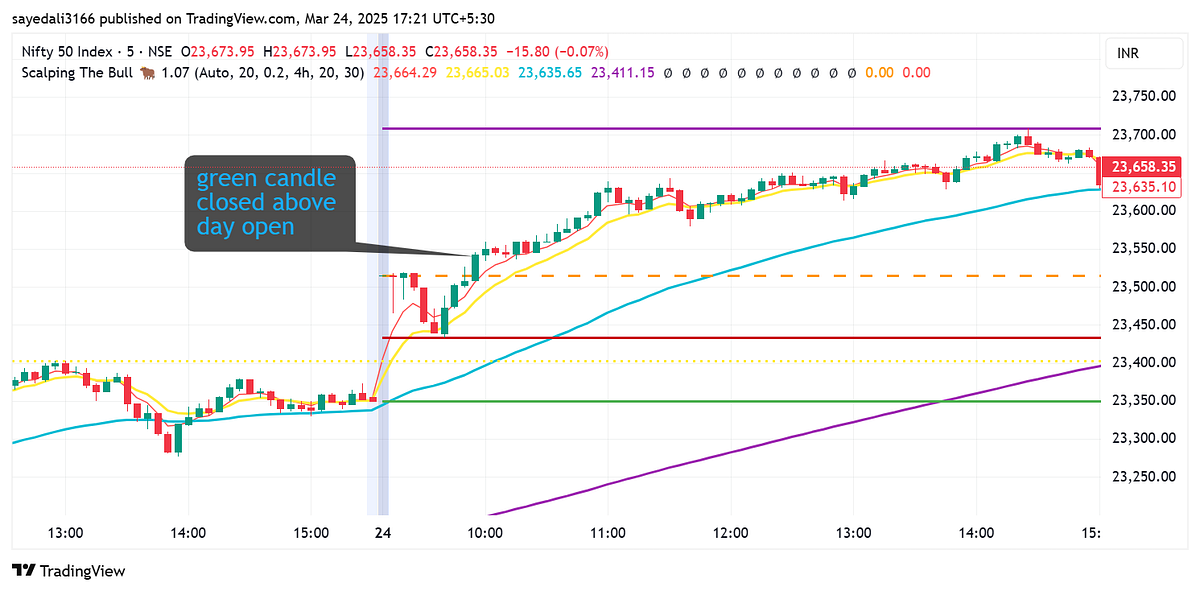
Let’s jump straight into the 5-minute chart.
Below are my new ebooks.
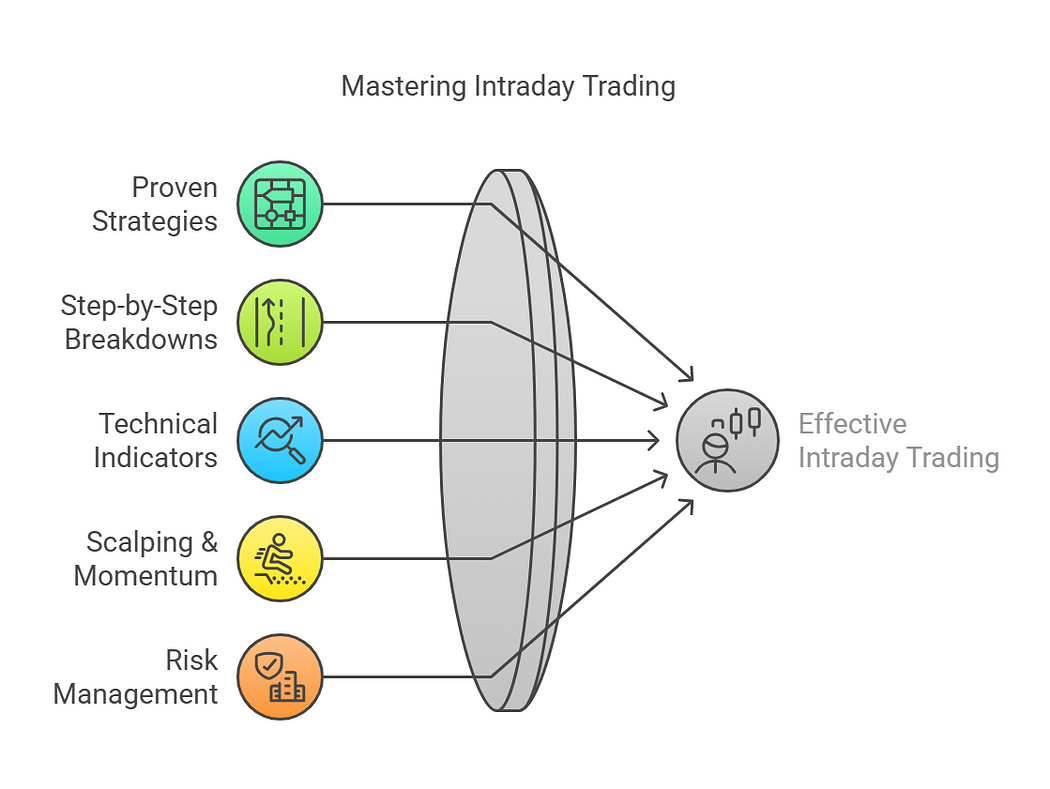
BUY NOW 25 Intraday Trading Strategies in 2025
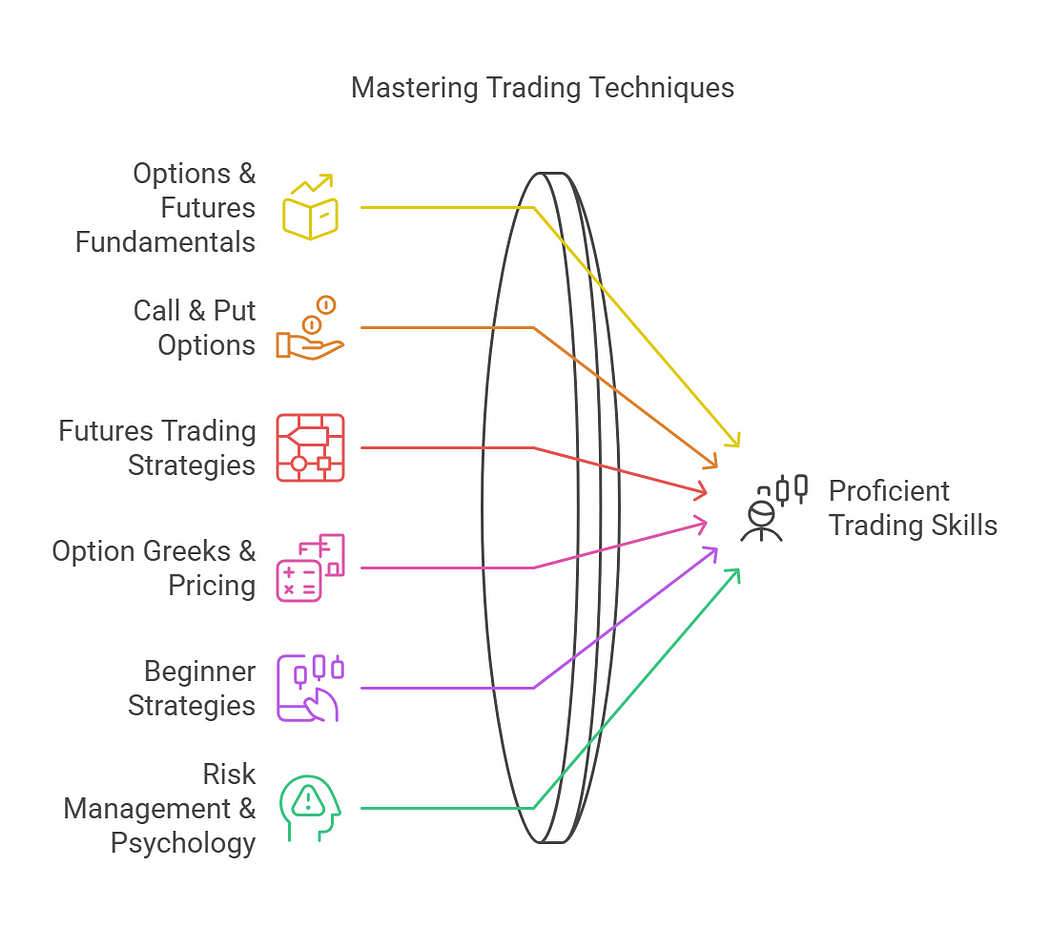
BUY NOW OPTIONS AND FUTURES FOR BEGINNERS 2025
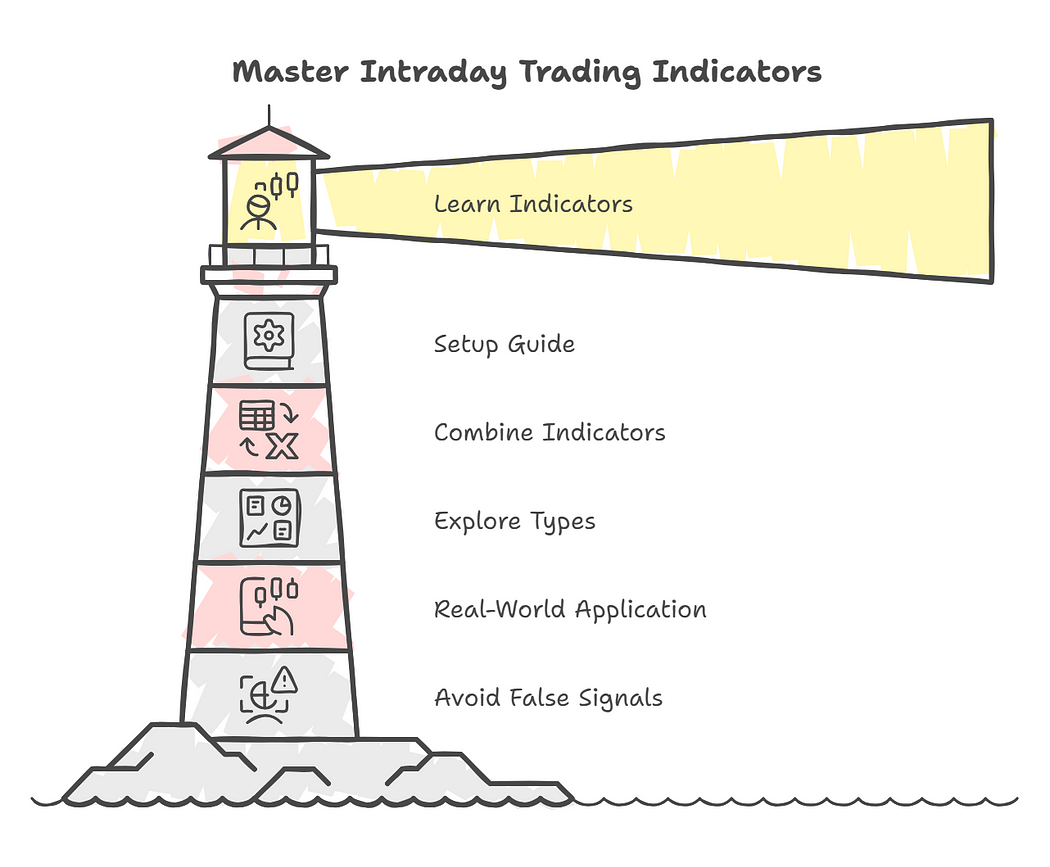
15 INTRADAY TRADING INDICATORS
‘Stock Market for Beginners’ — Your ultimate guide to understanding the stock market from scratch! Learn essential terms, beginner-friendly strategies, and how to grow your wealth — no prior experience is needed.
🎯 Indicators Used
⚙️ Indicator Setup
- Scalping The Bull Indicator (Autoconfiguration)
- EMAs: 10 (yellow), 60 (cyan), 223 (purple)
- Daily High (Purple Line)
- Yesterday’s High/Low (Yellow & Red dot Lines)
- Daily Open (Green Line)
- Timeframe: 5-Minute.
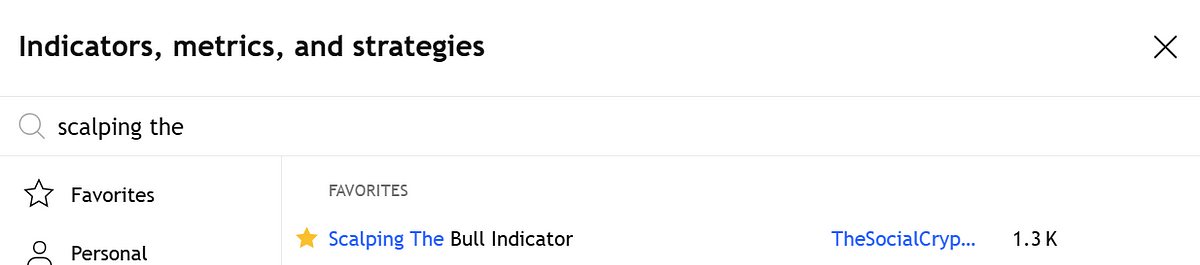
How to Add the Indicators
- Open TradingView.
- Go to Indicators → Search for Scalping The Bull.
3. Add it and adjust EMAs if not auto-configured (use 10/60/223 for crypto & altcoins, 10/50/200 for stocks).
4. Enable Trigger Points and Background Trend Coloring.
✅ Buy Conditions (Long Entry)
Use these when the trend is bullish (green background):
1. Trend Confirmation
- EMA 60 is above EMA 223
- Price is trading above both EMA 60 and EMA 223.
- EMA 10 is above EMA 60 → short-term strength.
2. Entry Triggers
Any one of these confluences can trigger a long:
- ✅ Third Touch of EMA 60:
Price touches EMA 60 three times, then closes above EMA 60 with a strong green candle. - ✅ Shimano Setup:
A series of candles closed between EMA 60 and EMA 223 followed by a breakout. - ✅ Breakout of a Trigger Point:
Price closes above Today’s High (purple) or Yesterday’s High (yellow). - ✅ Viagra Pattern:
Price shows consecutive closes above EMA 10.
3. Stop Loss
- Below the low of the entry candle or just under EMA 60 (whichever is safer).
4. Target
- Next trigger point (e.g., daily high, round number like 23,700).
- Or use a trailing stop (e.g., follow EMA 10).
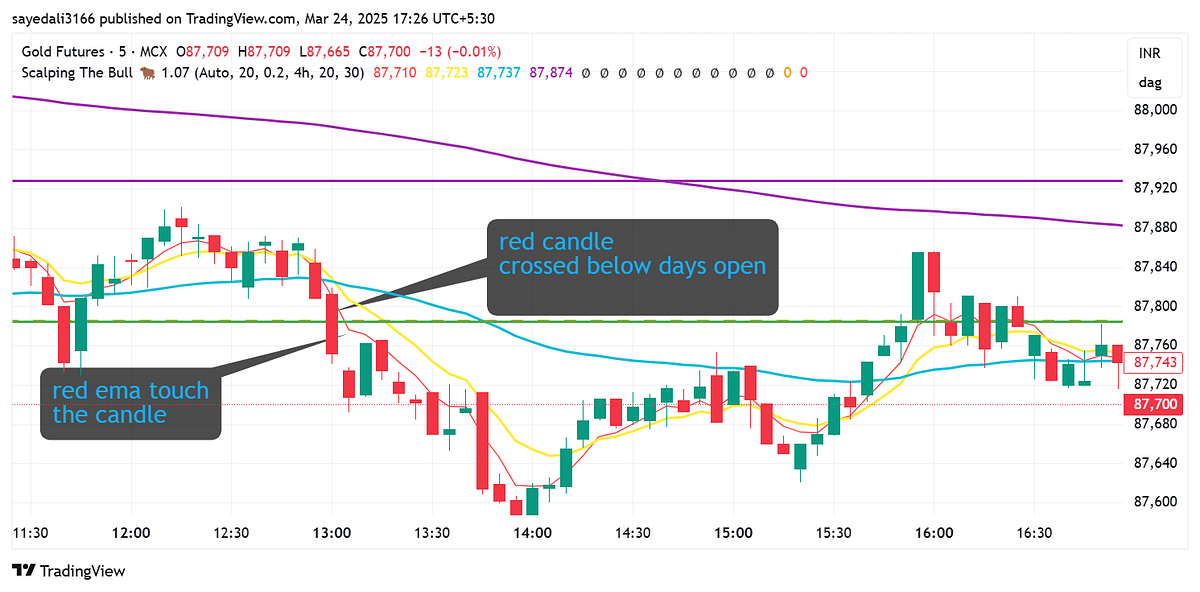
❌ Sell Conditions (Short Entry)
Use these when the trend shifts bearish.
1. Trend Confirmation
- EMA 60 is below EMA 223
- The price is trading below both EMA 60 and EMA 223.
- EMA 10 is below EMA 60.
2. Entry Triggers
- ❌ Downward Fake:
After a death cross, price returns above EMA 223 but fails to hold and closes back below EMA 223 and/or Yesterday’s High. - ❌ Price Drops 10% from Open (in volatile stocks or altcoins):
Near Yesterday’s Low or Daily Low — often marks panic selling zones. - ❌ Fake on EMA 10:
Candle opens above EMA 10, dips below, and closes back under it → bearish reversal.
3. Stop Loss
- Above the high of the breakdown candle or above EMA 10.
4. Target
- Previous low, daily low, or round number (e.g., 23,400 or 23,350).
- Or trail stop using EMA 10 in a downtrend.
Key Takeaways
- Trigger points like today’s high/low act as entry zones or resistance.
- The Third Touch of EMA 60 is powerful when followed by a bullish candle.
- This setup works best on altcoins, indices, or trending stocks.
Conclusion
This strategy capitalizes on straightforward signals from the “Scalping The Bull” indicator. The combination of EMA alignment, trigger points, and a green background sets a clear bullish context. Entries become relatively simple: buy breakouts or buy pullbacks as long as the EMAs remain stacked in a bullish order.
⚠️ Disclaimer
This is not financial advice. Always backtest any strategy and adjust position sizes based on your own risk tolerance. Use proper stop-loss and risk-reward management in all trades.