
If you’re trying to figure out when to enter and exit a trade without overcomplicating decisions, this article is for you. Many traders often ask, “How do I know the right time to buy or sell?” The answer lies in combining trend direction price movement, and volume and that’s exactly what this strategy does.
In this article, I’ll walk you through a simple but powerful trading strategy using the Dragon and Trend Line indicator with the Volume pressure indicator. This method helps you avoid random trades and instead gives you a clear structure on when to enter, where to place your stop loss, and how to ride the trend confidently.
Many of the new comers in trading have one question in mind”How do I earn profits in intraday Trading?”
By following the strict rules you can make profits slowly. All you need is a trading setup. Stick to one startegy and test it in multiple assets like stocks,futures,options,ETF & cryptos.
🧠 What Is the Dragon and Trend Strategy?
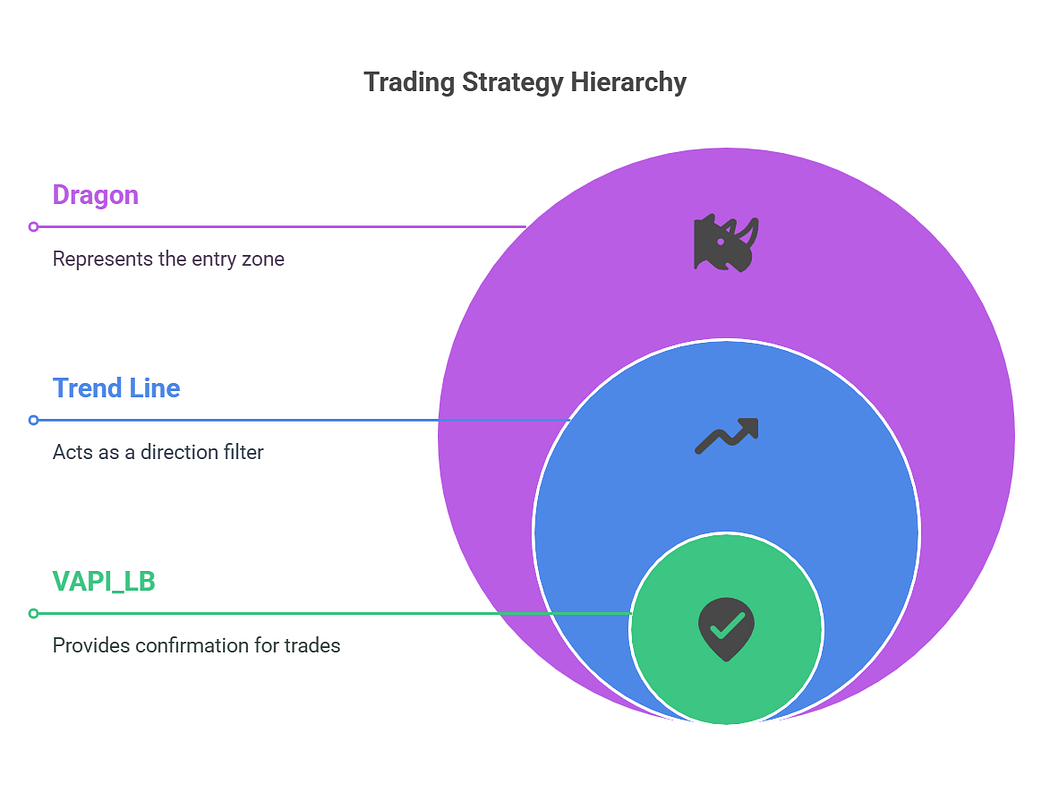
This strategy uses moving averages and volume indicators to help you spot high-probability trades. It is built around two main components:
- The Dragon — a 34-period EMA that forms a band with price highs and lows.
- The Trend Line — an 89-period EMA that helps identify the overall market direction.
These two indicators combined give you a visual roadmap of what the market is doing — whether it’s trending up, trending down, or moving sideways.
Below are my new ebooks.
BUY NOW 25 Intraday Trading Strategies in 2025
BUY NOW OPTIONS AND FUTURES FOR BEGINNERS 2025
15 INTRADAY TRADING INDICATORS
‘Stock Market for Beginners’ — Your ultimate guide to understanding the stock market from scratch! Learn essential terms, beginner-friendly strategies, and how to grow your wealth — no prior experience is needed.
📦 Tools You’ll Need (Indicators)
You’ll need two indicators including one volume confirmation tool. All of the indicators are available for free on TradingView.
1. Dragon and Trend Indicator
- Built on 34 EMA (Dragon) and 89 EMA (Trend Line)
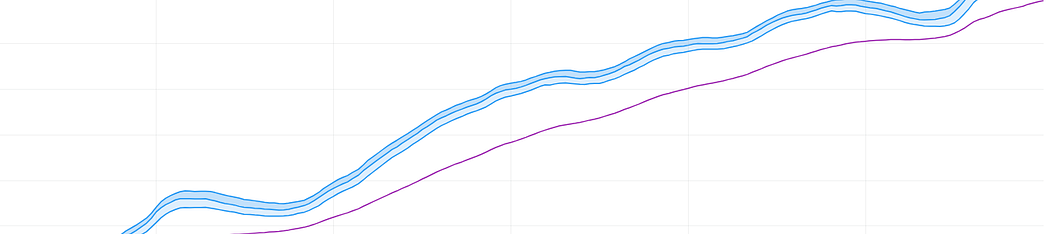
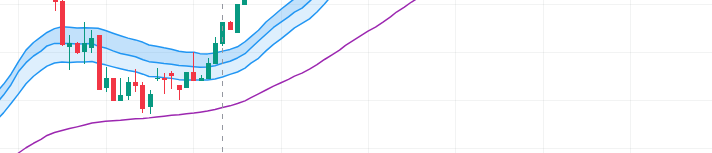
- The Dragon appears as a blue band (based on 34 EMA of close, high, and low)
- The Trend Line appears as a single purple EMA line (89 EMA close)
2. VAPI_LB Indicator
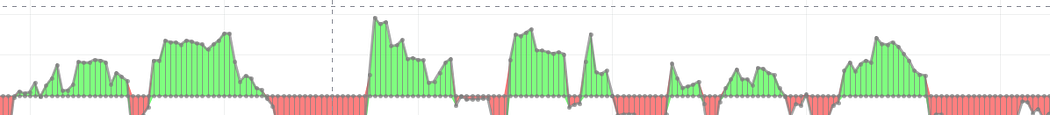
- This volume-based histogram shows bullish (green) and bearish (red) pressure.
- Helps you confirm whether price action is supported by strong volume.
🔍 Understanding the Indicators Visually
Let’s break it down:
- The Dragon (blue band) acts like a flexible zone. Price often pulls back to this zone before continuing its trend.
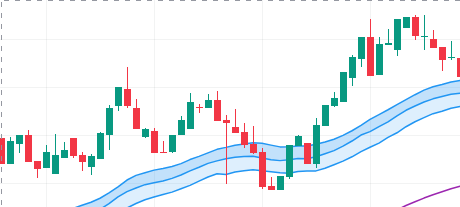
- The Trend Line (purple) shows the overall direction of the market. If it’s pointing up, we’re in an uptrend. If it’s pointing down, we’re in a downtrend.
- The VAPI_LB helps us avoid fakeouts by confirming when volume supports the price move.
⚙️ How to Add the Indicators in TradingView
- Open your TradingView chart.
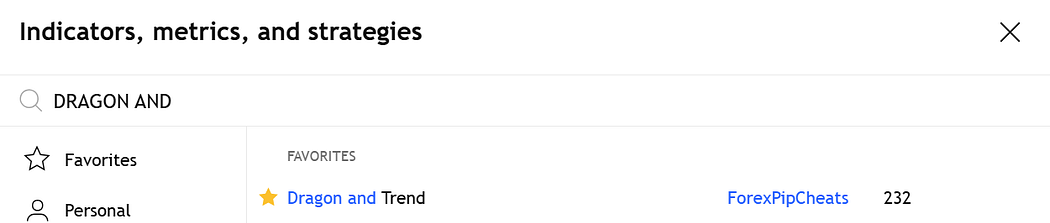
- Click on “Indicators.”
- Search and add: Dragon and Trend
4. Search and add: VAPI_LB
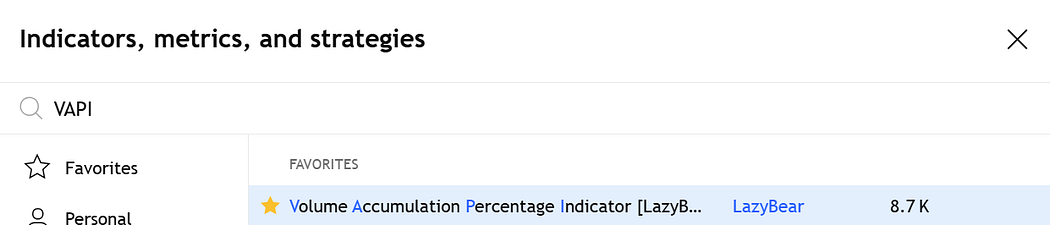
5. You’re all set — no need to change settings unless you want to tweak EMAs.
Use a clean layout and avoid adding too many indicators. Simplicity is power.
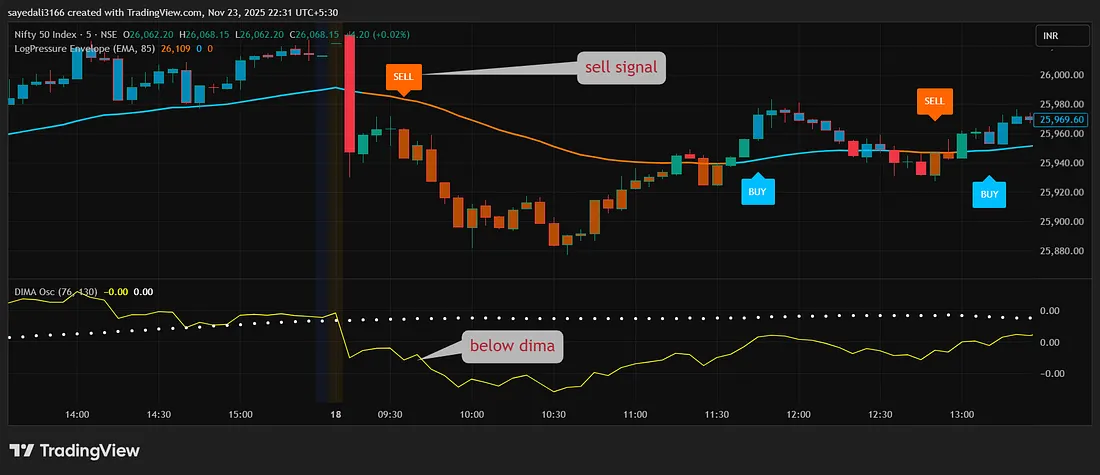
🟢 When to Buy (Long Setup)
Here’s how to identify a long (buy) opportunity using this system:
✅ Buy Conditions
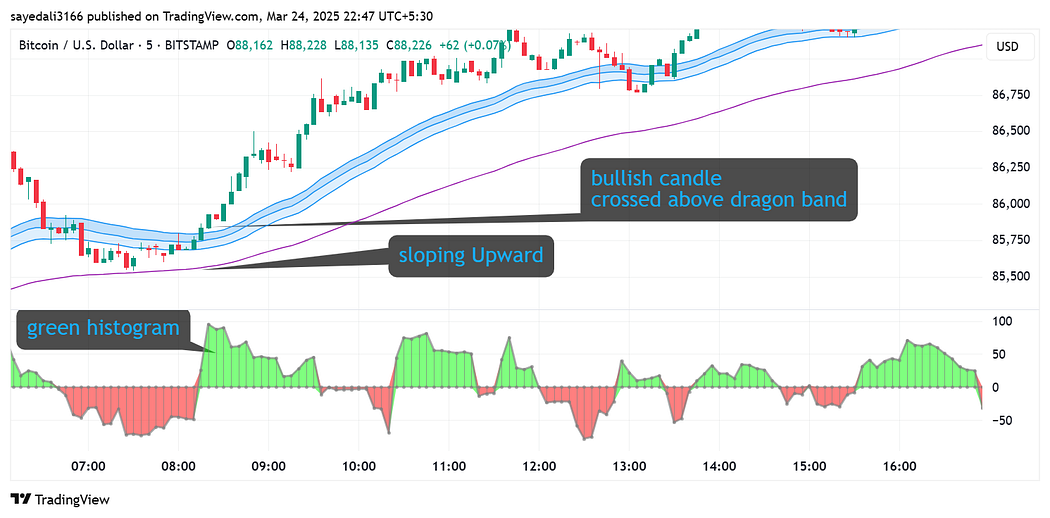
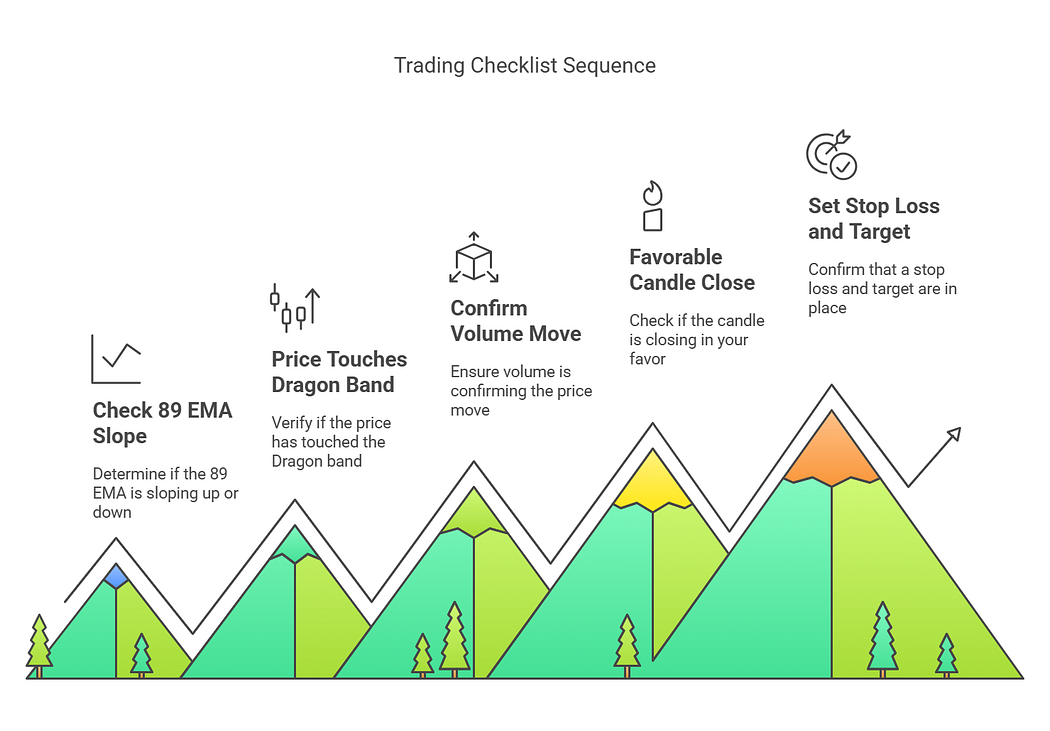
- The 89 EMA (purple line) is sloping upward.
- Candle comes down and touches or enters the lower area of the Dragon band.
- At the same time, the VAPI_LB indicator shows green bars (volume supports the move).
- A bullish candle forms and closes above the middle line of the Dragon (34 EMA close).
- Enter a long position at the opening of the next candle.
🛑 Stop Loss for Long
- Place your stop loss below the lower Dragon band or the recent swing low.
🎯 Take Profit for Long
- First target: recent swing high.
- Second target: let it ride with a trailing stop below the Dragon band.
🔴 When to Sell (Short Setup)
Here’s how to identify a short (sell) trade:
✅ Sell Conditions
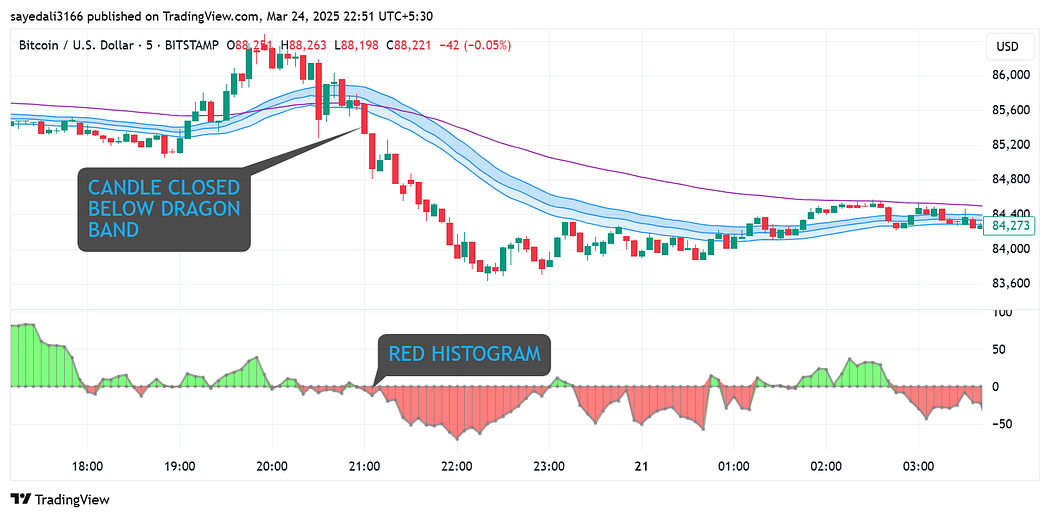
- The 89 EMA is sloping downward.
- Price rallies and touches or enters the upper part of the Dragon band.
- The VAPI_LB indicator shows red bars (bearish volume pressure).
- A bearish candle closes below the Dragon’s middle line.
- Enter a short position at the next candle’s open.
🛑 Stop Loss for Short
- Place your stop loss above the upper Dragon band or above the recent swing high.
🎯 Take Profit for Short
- First target: recent support zone.
- Second target: trail your stop as the trend continues.
Intraday Trading Platform
Now you have a setup right?
The Next thing is a trading platform. I am using the discount broker zerodha and Upstox. For charting and anlysis I am using Tradingview Platform.
📈 Why This Strategy Works
The Dragon and Trend Line strategy works because it:
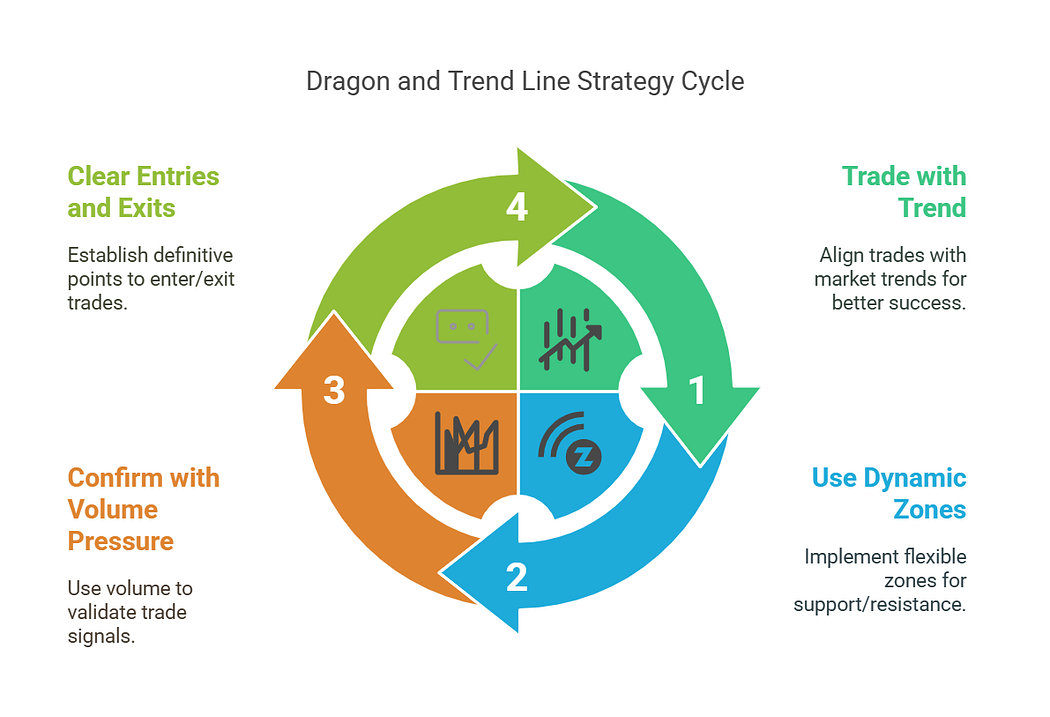
- Keeps you trading with the trend (not against it).
- Uses dynamic zones instead of fixed support/resistance.
- Confirms with volume pressure, which many traders ignore.
- Gives clear entries and exits, reducing emotional decisions.
You’re not just buying blindly — you’re entering when the price pulls back, volume supports the move, and trend direction aligns. That’s what smart trading is all about.
📌 Quick Checklist Before You Trade
If the answer is yes to all, you’ve got a solid setup.
🛡️ Risk Management Reminder
This strategy gives structure — not guarantees. No system is perfect. Always:
- Risk only a small % of your capital per trade.
- Avoid trading during high-volatility news.
- Practice on a demo before going live.
- Accept losses as part of the game.
Trading can succeed only through experience.