
If you’re constantly overwhelmed by trading strategies that demand five indicators, countless lines, and a PhD in technical analysis — you’re not alone.
Intraday trading should be clear, actionable, and fast. And that’s exactly what the DEMA Oscillator Strategy offers — a minimalist yet powerful system that strips away the noise and delivers clean, confident entries.
Whether you’re a scalper looking for high-frequency setups or a short-term intraday trader wanting precision, this strategy gives you a structured approach with crystal-clear Buy/Sell signals, defined risk, and high win potential.
Let’s break it down.
📌 What Is the DEMA Oscillator?
DEMA stands for Double Exponential Moving Average, but the version we’re using here is more advanced — the Normalized DEMA Oscillator SD (also called Dema Oscillator). It’s a customized momentum oscillator that analyzes the divergence between two Displaced Moving Averages (DMAs), helping you spot early trend reversals and momentum shifts with minimal lag.
🧠 Why DEMA Over Regular EMA or SMA?
While most traders rely on standard EMAs or SMAs, DEMA smoothens the average more efficiently and responds faster to price action, reducing the delay in signals. This means quicker decision-making and better entries for intraday and scalping trades.
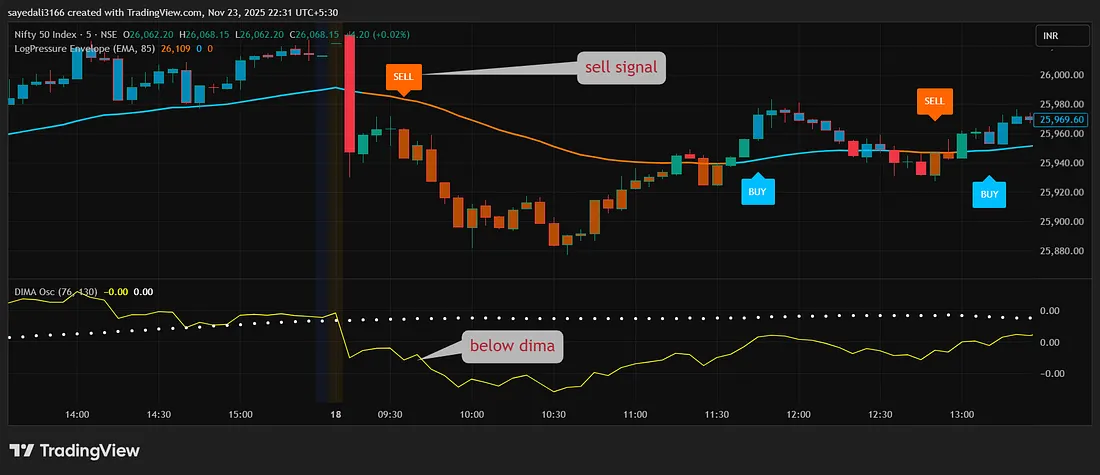
When the Dimma Oscillator crosses above or below the zero line, it signals a bullish or bearish momentum shift — simple, visual, and effective.
🚀 Why This Strategy Works
- Lag-Free Setup: DEMA reacts faster than regular MAs, giving you early signals.
- Noise Filtered Out: The oscillator reduces false entries during sideways moves.
- Clear Rules: Defined entries, stop loss, and take profit — no ambiguity.
- Visually Simple: Color-coded candles and oscillator position make it intuitive.
- Perfect for Beginners and Pros: If you’re tired of complex setups, this one simplifies your chart.
🖥️ How to Set Up the DEMA Oscillator on TradingView
- Open TradingView and load a 5-minute chart.
- Click on the Indicators tab at the top.
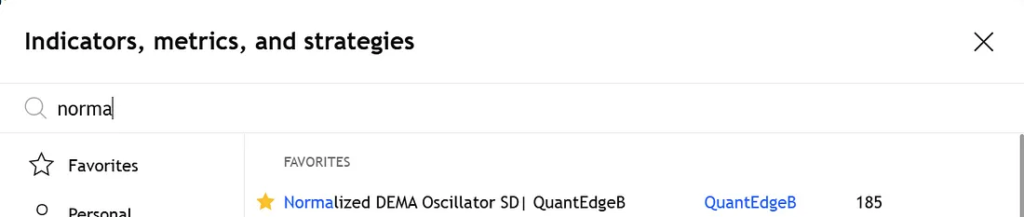
- Search: “Dema Oscillator SD”
- Select: “Normalized Dema Oscillator SD” by author Sinwave or similar version.
- Save it to your favorites ⭐ for quick access.
📎 Here’s a direct link to TradingView if you need to sign up or access charts.
✅ Buy Entry Conditions
This setup focuses on momentum breakout entries using visual confirmation.
Buy When:
- ✅ The Dimma Oscillator crosses above the zero line ➜ Signals bullish momentum.
- ✅ Candle changes color from red to blue.
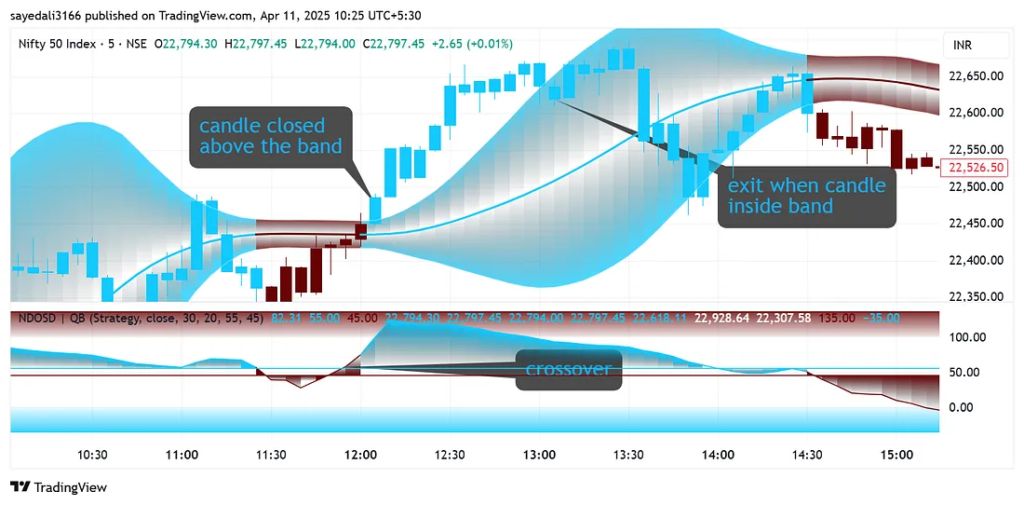
- ✅ The candle is above the Dema Bands but not touching them.
Stop Loss → Place just below the lower Dimma Band.
Target → Use a 1:1.5 Risk-to-Reward ratio.
❌ Sell Entry Conditions
This is the same as the buy setup — but in reverse.
Sell When:

- ✅ The Dimma Oscillator crosses below the zero line ➜ Indicates bearish pressure.
- ✅ Candle changes color from blue to red.
- ✅ The candle is below the Dimma Bands but not touching them.
Stop Loss → At the upper Dema Band.
Target → 1:1 or 1:1.5 Risk-to-Reward ratio depending on market volatility.
🧪 How to Backtest the DEMA Oscillator Strategy
Before going live, backtesting helps you build confidence, understand drawdowns, and spot tweaks for optimization.
Step-by-Step Backtest Guide:
- Open the 5-minute chart on TradingView.
- Add the Normalized Dema Oscillator SD.
- Scroll back in time — disable auto-scroll.
- Enable Bar Replay Mode from the top toolbar.
- Go candle-by-candle, looking for:
- Oscillator crossing zero
- Color change
- Candle position relative to the bands
- Log each trade:
- ✅ Entry price
- ❌ Stop loss (at Dimma Band)
- 🎯 Take profit (1:1 or 1:1.5)
- 📉 Win or loss
🔑 Pro Tip: Test 50–100 trades minimum to get a clear picture of accuracy, drawdown, and profit factor.
💡 Key Insights and Advanced Tips
Here’s what separates successful traders from average ones using this setup:
- Trade major Forex pairs like EUR/USD, GBP/JPY, or USD/JPY — they’re liquid and less prone to fakeouts.
- Avoid tight range markets — this strategy works best in trending or breakout conditions.
- Don’t enter if the candle touches the bands — that often leads to false signals.
- Use a trading journal like Edgewonk or Google Sheets to refine your edge over time.
- Never risk more than 1–2% of your capital per trade. Period.
🔄 Combine for Confluence (Optional But Powerful)
Although the DEMA Oscillator strategy can be used standalone, combining it with 1–2 other tools can give you an extra layer of confirmation:
📊 Volume Profile
Look for volume surges to confirm breakout momentum. Combine with Volume Profile Indicator.
📈 EMA (20 or 50)
Add a simple EMA to check if price aligns with the overall trend.
🧱 Price Action Zones
Draw support/resistance zones to validate if the breakout is coming from a strong level.
🛠️ Tools & Resources to Maximize This Strategy
- 📘 Stock Market for Beginners — eBook
- 📘 10 Buy and Sell Indicators
- 📘 25 Intraday Strategies for 2025 — eBook
- 📘 Advanced Indicators for Trading — eBook
- ☕ Support my work on Buy Me a Coffee
📢 Final Thoughts: Simplicity Wins
The DEMA Oscillator Strategy is perfect for intraday traders who crave clarity and fast signals without clutter. If you’re struggling with information overload or messy charts, this setup brings structure and confidence back into your trades.
Trading doesn’t have to be complicated. All you need is:
- A solid system
- Backtesting
- Discipline
- Consistency
Master this, and you’re already ahead of 90% of retail traders.
🎁 Bonus: More From TradeTalksHub
- ✅ More Trading Strategies on TradeTalksHub.com
- 📘 Options and Futures for Beginners 2025 — eBook
- 📘 15 Intraday Indicators — eBook
📌 Disclaimer
Trading involves substantial risk and is not suitable for every investor. The strategies mentioned are for educational purposes only. Please backtest, paper trade, and consult a financial advisor before live trading.