
How To Trade In BTC?
Tired of Guessing?
Dont worry…..This article is for you.
If you’re tired of second-guessing your trades and getting caught in market noise, you’re in the right place. Today, I’m revealing a powerful strategy that combines two of the most effective indicators on TradingView: The Triple Trend Indicator and the Elliott Wave Oscillator.
If you can understand the trend of the market you can survive in the market without much loss.
Let’s break it down step by step.
Ready to transform your financial future and dominate the stock market? Whether you’re a beginner looking to take your first steps or a trader hungry for proven strategies, I’ve got you covered! 📘
‘📗 ’25 Intraday Strategies in 2025🚀 Don’t miss this opportunity to supercharge your financial journey. Get both ebooks now on Gumroad and start building your path to success today!” ‘ is packed with powerful, easy-to-follow setups designed to maximize your trading profits this year. From quick scalps to trend-following techniques, this book gives you the edge to crush the markets like a pro.

Stock Market for Beginners is your ultimate guide to understanding the market from scratch. Learn essential terms, beginner-friendly strategies, and how to start growing your wealth — no experience needed!
Indicators Setup
1. Triple Trend Indicator
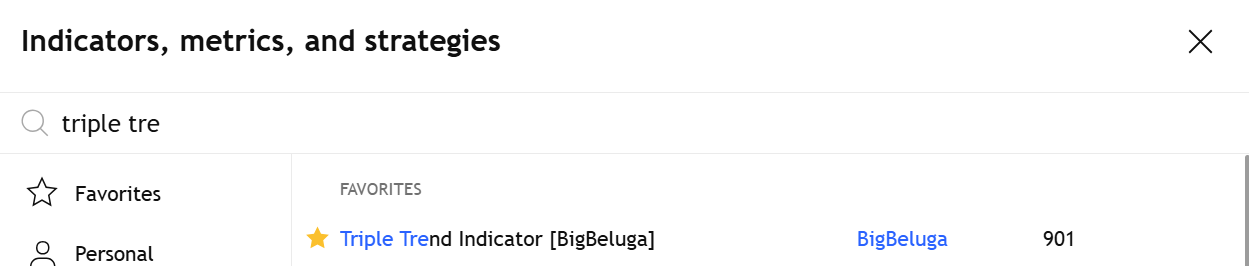
- Open TradingView and go to the Indicators tab.
- Search for Triple Trend Indicator and add it to your chart.
2. Elliott Wave Oscillator
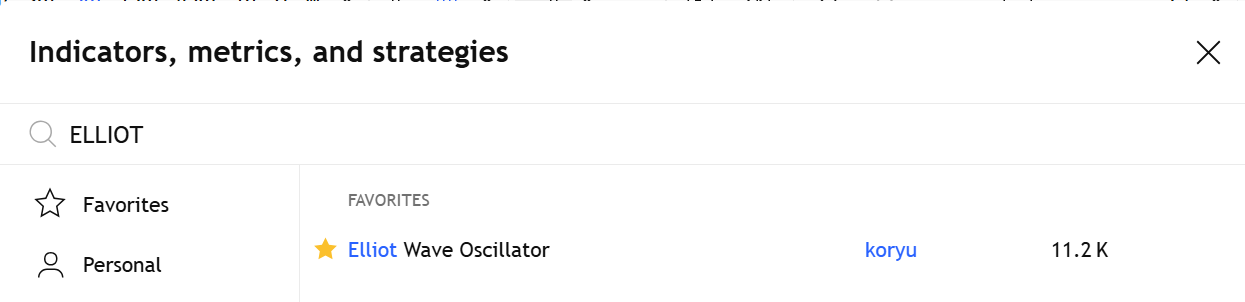
- Search for Elliott Wave Oscillator and add it to the chart.
Now, let’s get to the most important part — how to trade with this strategy.
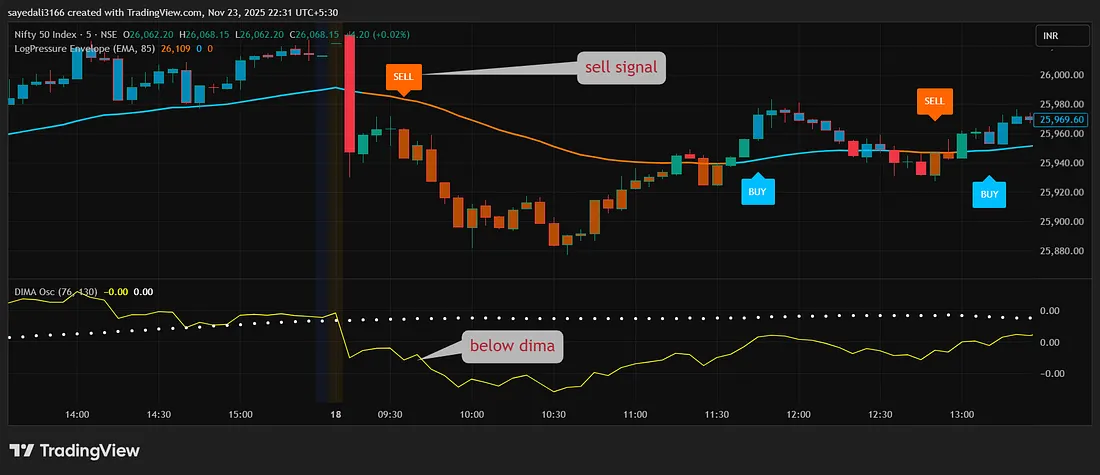
Buy Entry Conditions
🎯 Enter a Buy Trade when all these conditions align. 📍 Stop-Loss: Below the second Triple Trend MA line. 🎯 Take-Profit: 1:1.5 risk-to-reward ratio.
✅ The Triple Trend Indicator turns the MA lines green.
✅ The Candle should close above the Triple Trend MA lines.
✅ The Elliott Wave Oscillator prints a green bullish histogram.
✅ A bullish candle confirms the setup.
🎯 Enter a Buy Trade when all these conditions align.
📍 Stop-Loss: Below the second Triple Trend MA line.
Sell Entry Conditions
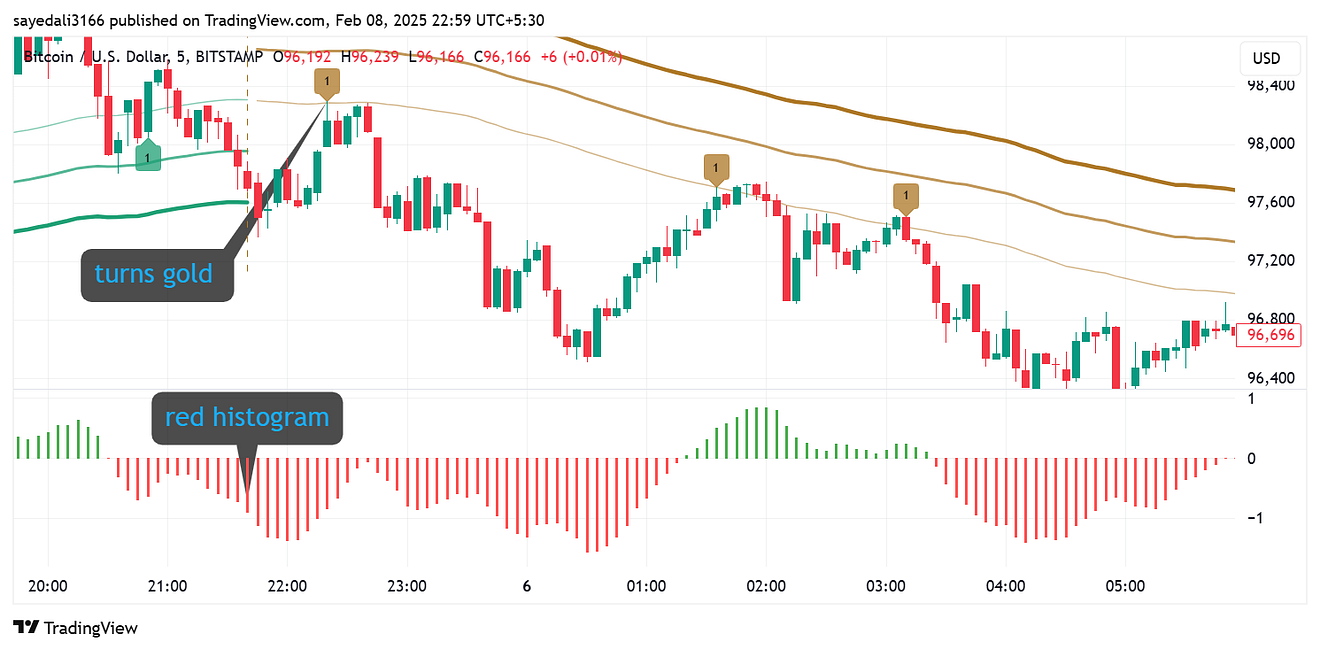
✅ The Triple Trend Indicator turns the MA lines gold.
✅ The candle should close below the Triple Trend MA lines.
✅ The Elliott Wave Oscillator prints a red bearish histogram.
✅ A bearish candle confirms the setup.
🎯 Enter a Sell Trade when all these conditions align.
📍 Stop-Loss: Above the second Triple Trend MA line.
🎯 Take-Profit: 1:1.5 risk-to-reward ratio.
Key Takeaways
✔ Combining these indicators increases accuracy and reduces false signals.
✔ The strategy works well on forex, stocks, and indices.
✔ It is best suited for the 5-minute timeframe.
✔ A risk-to-reward ratio of 1:1.5 ensures a solid risk management plan.
✔ Consistent practice leads to mastery — test it on a demo before trading live.
The Triple Trend + Elliott Wave Oscillator Strategy is a powerful trend-following system that can help you make informed trading decisions. However, no strategy guarantees 100% success, so always use proper risk management and trade responsibly.
If you found this strategy useful, don’t forget to share your thoughts in the comments below! Happy Trading! 🚀
Disclaimer: Trading involves risk, and past performance is not indicative of future results. This content is for educational purposes only and should not be considered financial advice. Always conduct your own research and consult with a professional before making any trading decisions.