If you’ve ever felt frustrated by sideways markets or confused by too many indicators, you’re not alone. Most traders overcomplicate things — adding more tools, more confluence, and still ending up in losing trades.
This post is going to simplify all of that.
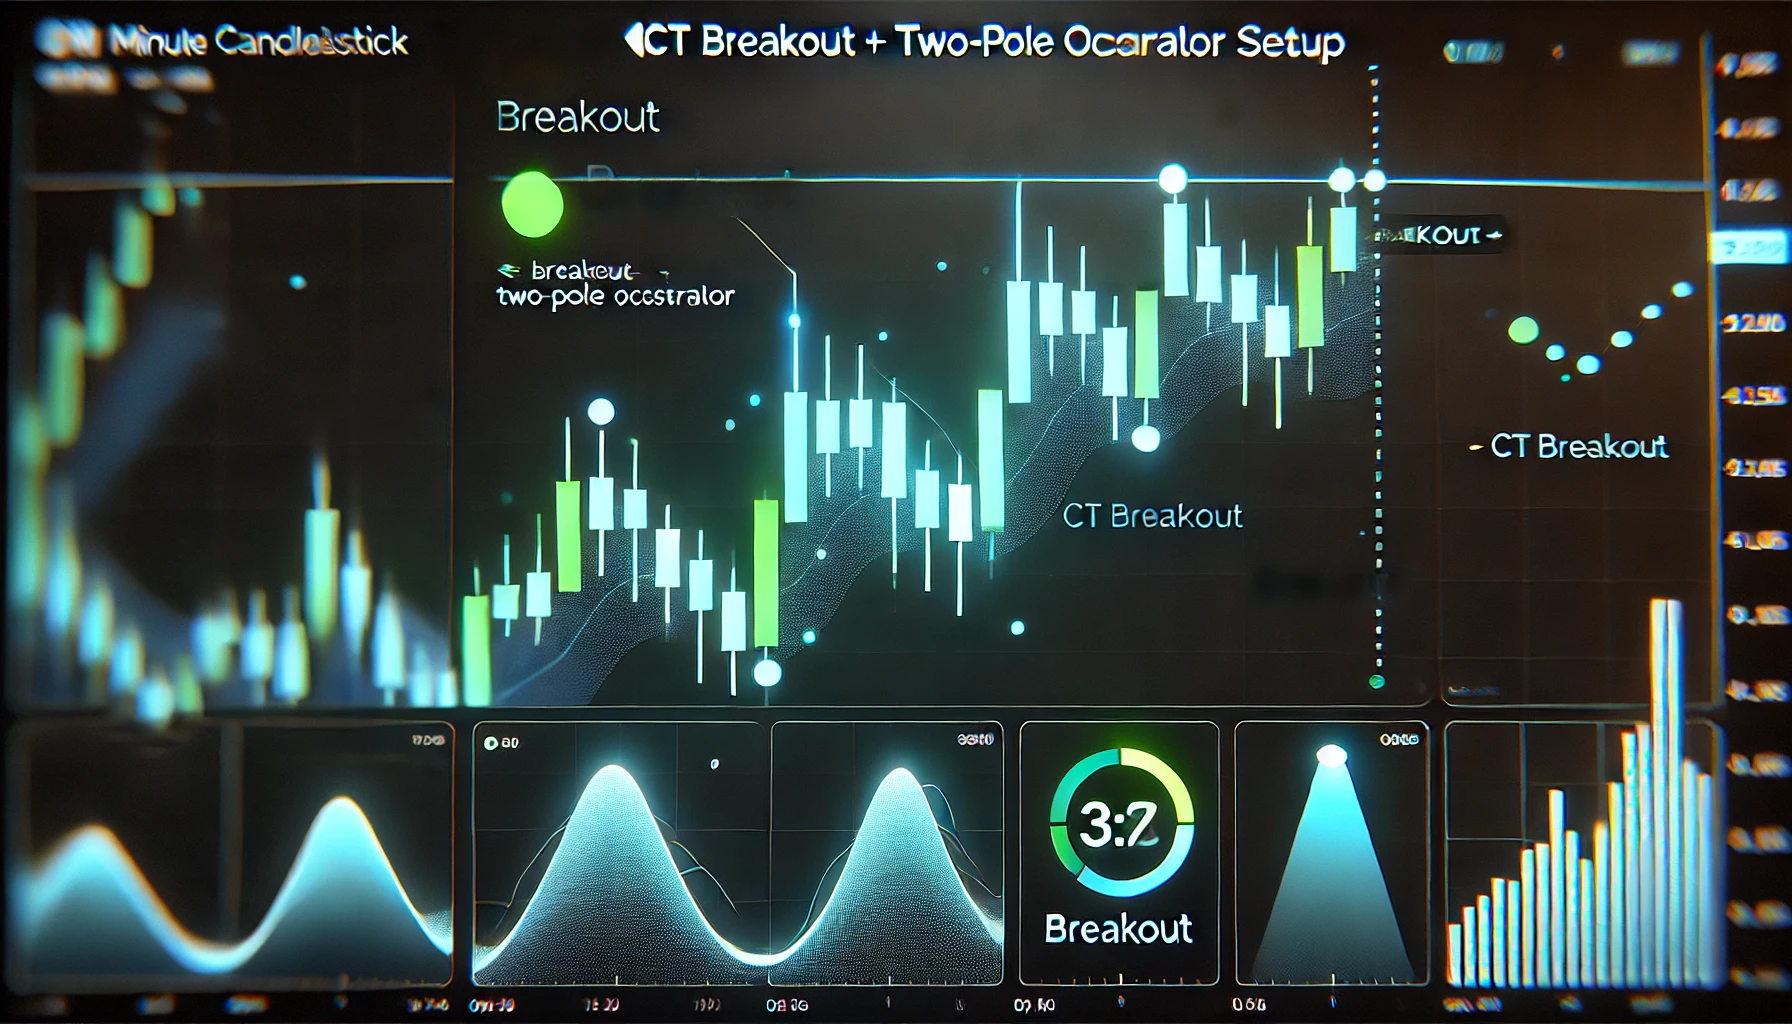
👉 In this strategy, we use just two powerful indicators to catch high-probability breakout trades:
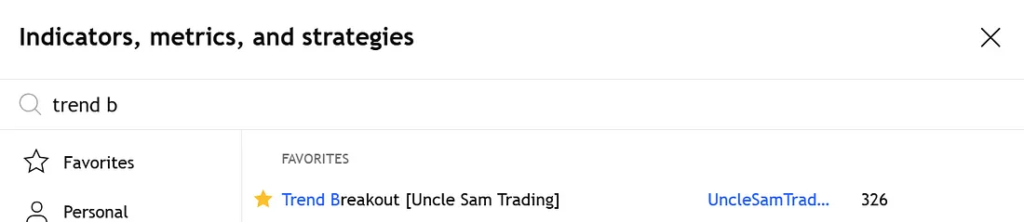
🔹 CT Breakout Labels [Uncle Sam Trading]
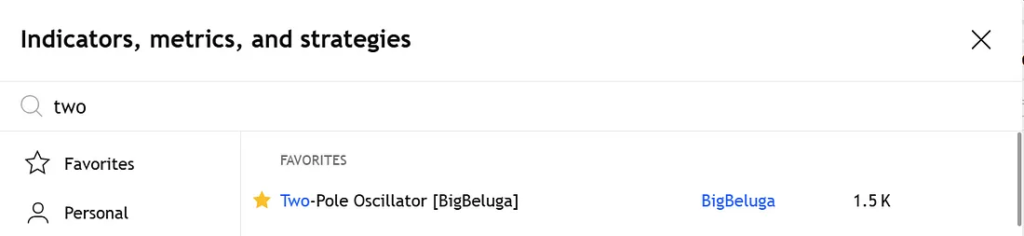
🔹 Two-Pole Oscillator [BigBeluga]
Together, these tools filter fakeouts, confirm trends, and give clean buy and sell signals with precision.
Let’s dive into this momentum breakout strategy that even beginners can use confidently.
🔍 The Core Idea
This strategy is built around two strong trading principles:
- Breakout Confirmation: Using CT Breakup/Breakdown signals to identify when the price breaks out of a range.
- Momentum Validation: Using the Two-Pole Oscillator to confirm the direction of strength and avoid false signals.
You don’t need to be a pro — just follow the signals and manage your trades with discipline.
🔧 Indicator Setup
1. CT Breakout by Uncle Sam Trading
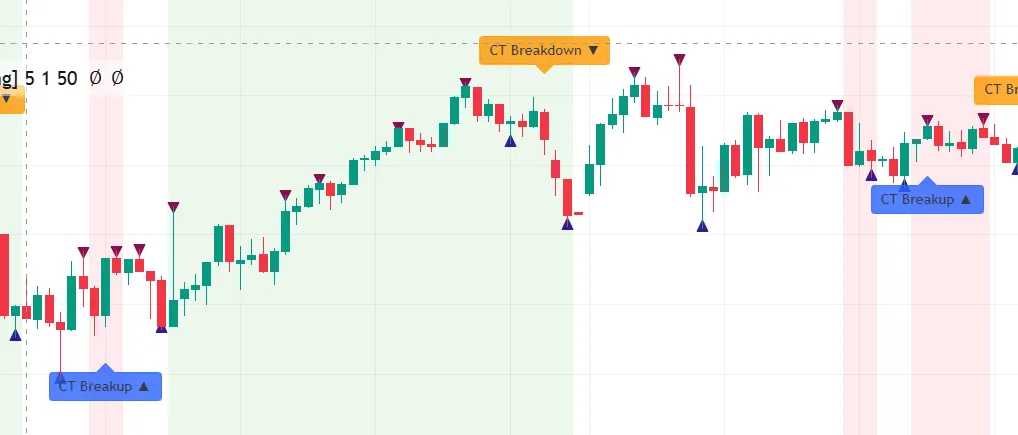
This indicator identifies consolidation zones and marks moments where the price is ready to break out.
Settings:
- Lookback:
5 - Sensitivity:
1 - Filter Strength:
50
Key Signals:
- 🟩 CT Breakup = Potential Bullish Breakout
- 🟥 CT Breakdown = Potential Bearish Breakout
2. Two-Pole Oscillator by BigBeluga
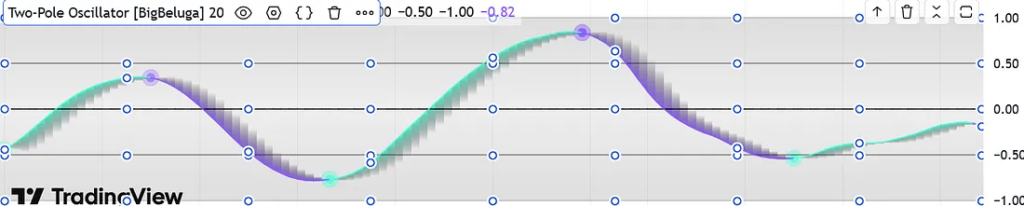
This is a momentum cycle indicator that helps spot early reversals or exhaustion points.
Settings:
- Length:
20
How to Read It:
- 🔼 Curving up from below zero → Bullish reversal
- 🔽 Curving down from above zero → Bearish reversal
- Above
+0.7= Overbought (exit long) - Below
-0.7= Oversold (exit short)
If you wish to know more Trading hacks you can read here
📈 How to Add the Indicators on TradingView
- Open TradingView
- Click on
Indicators - Search:
✅CT Breakout (Uncle Sam Trading)
✅Two-Pole Oscillator (BigBeluga) - Apply them to a
5-minute chart - Use default settings or adjust based on asset volatility
🟢 Buy Entry Rules (Long Setup)
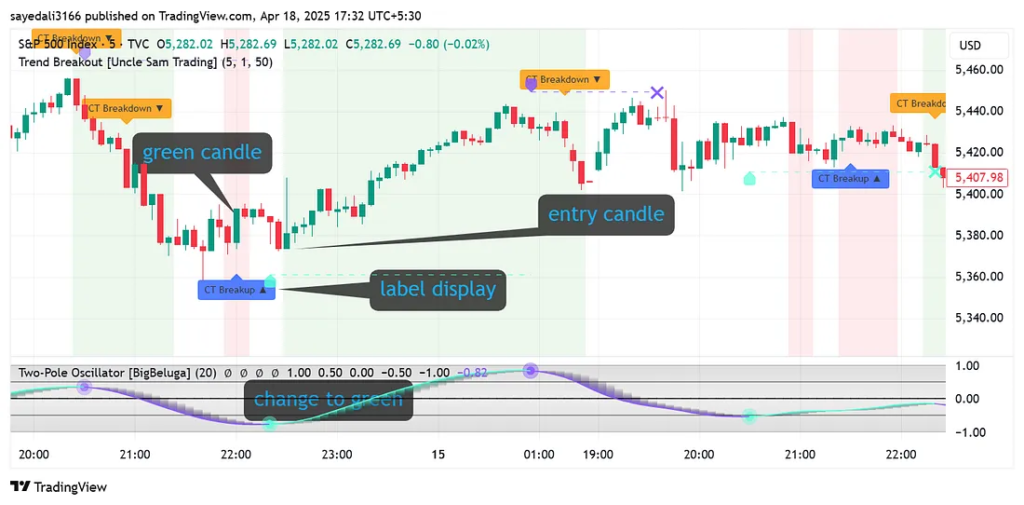
Conditions:
- ✅ CT Breakup appears below a green candle
- ✅ Two-Pole Oscillator is below 0 and curving upward
- ✅ A green dot appears (bottomed-out cycle)
- ✅ Background is narrow red (early shift in pressure)
Confirmation:
- Price breaks above previous candle’s high
- Volume spike (optional but helpful)
Entry: Next candle after confirmation
Stop-Loss: Recent swing low
Target: Oscillator reaches above +0.7 or curves downward
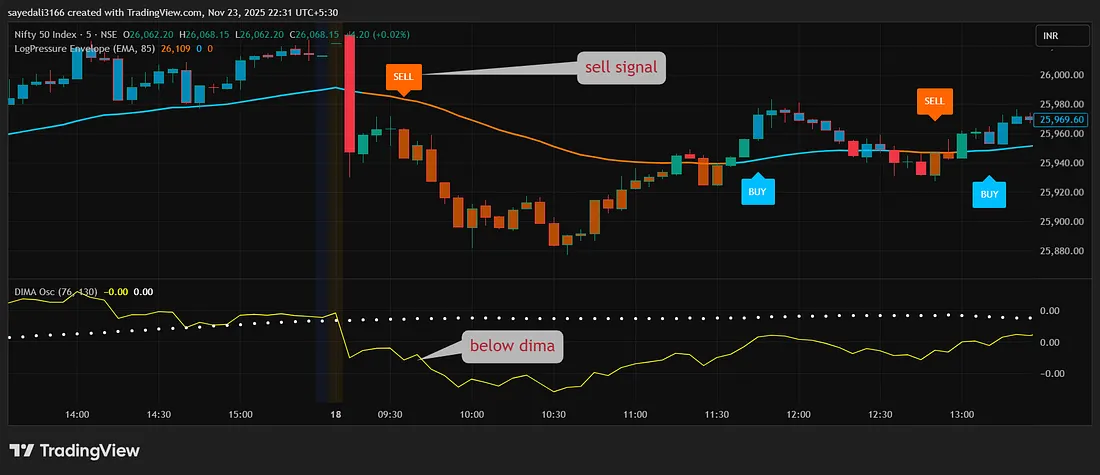
🔴 Sell Entry Rules (Short Setup)
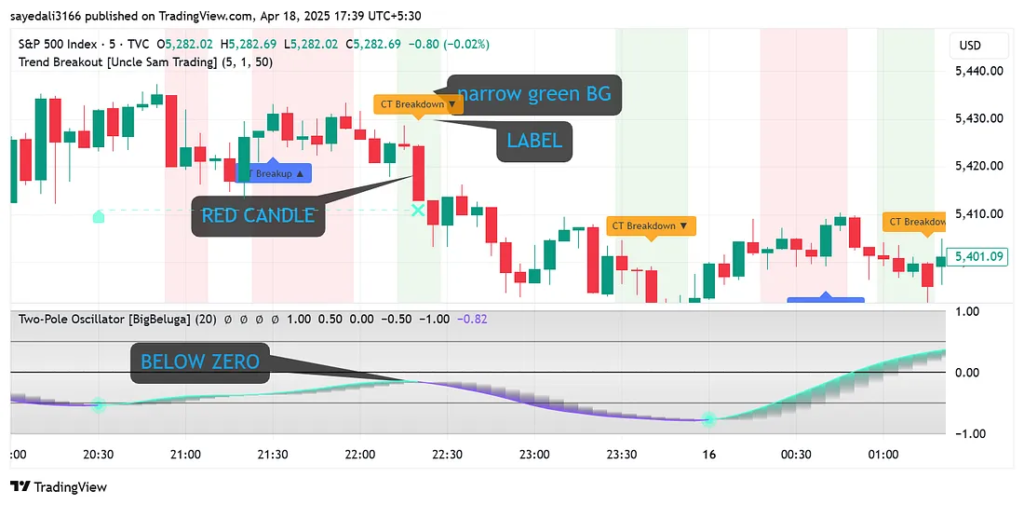
Conditions:
- ✅ CT Breakdown appears above a red candle
- ✅ Two-Pole Oscillator is above 0 and curving downward
- ✅ A purple dot appears (cycle top)
Confirmation:
- Price breaks below the previous candle low
- Continued bearish momentum
Entry: Next candle after CT Breakdown
Stop-Loss: Recent swing high
Target: Oscillator drops below -0.7 or flattens out
💡 Key Tips to Remember
- ❌ Don’t trade on CT labels alone — confirm with the oscillator!
- ⚠️ Avoid flat oscillator zones (near zero) → usually sideways chop
- ✅ Works best on high-volume assets like Nifty50, S&P 500, BTC/USD
- ⏰ Ideal trading time: 9:30–11:30 AM or 1:30–3:00 PM (high volatility windows)
🔄 How to Backtest This Strategy
- Load indicators on a 5-minute chart
- Scroll back and mark:
- CT Breakup/Breakdown labels
- Oscillator movement (dot + curve direction)
- Track:
- ✅ Win/Loss Ratio
- ✅ Average R:R
- ✅ Time held in trade
- Log results in Excel/Google Sheets
- Optimize stop-loss & target based on historical performance
📌 Pro Tip: Set TradingView alerts on “CT Breakup” or “CT Breakdown” for semi-automated scalping.
🎯 Who Is This Strategy For?
✅ Beginners looking for clear entries
✅ Scalpers who trade S&P 500 / BTC / Nifty
✅ Traders who hate laggy indicators and love price action with momentum
📚 FAQ – Quick Answers
Q1: Can I use this for crypto trading?
Absolutely. Works well on BTC, ETH, and SOL — especially during high-volume hours.
Q2: Best time frame?
5-min for intraday. You can also scale it to 15-min or 1H for swing setups.
Q3: Is the Two-Pole Oscillator better than RSI?
Yes. It’s smoother, reacts quicker, and helps with short-term cycle detection.
Q4: Is this beginner-friendly?
Definitely. Easy-to-read signals, especially once you backtest a few trades.
✅ Final Thoughts
The CT Breakout + Two-Pole Oscillator combo is your tactical edge in a noisy market. With just two tools, you can spot momentum shifts, ride strong trends, and avoid sideways traps.
Whether you’re catching a breakout on BTC or shorting Nifty reversals, this system is simple, effective, and beginner-approved.
🎯 Start using this strategy today and make your intraday trades count.
📘 Want More Like This? Explore My eBooks 👇
If you found this strategy helpful, imagine having 25 more like this — all tested, beginner-friendly, and powerful.
🔥 New Releases on Gumroad:
- ✅ 25 Intraday Trading Strategies in 2025
- ✅ Options and Futures for Beginners 2025
- ✅ 15 Intraday Trading Indicators
- ✅ Stock Market for Beginners — Your complete guide to stock investing from scratch