
If you’ve ever missed the perfect trade entry and thought, “Why didn’t I spot that sooner?” — you’re not alone. Trading isn’t just about market knowledge; it’s about timing, confirmation, and discipline.
What if two powerful indicators could give you near-perfect buy/sell signals?
Sounds too good to be true?
Let’s dive in.
🔍 Meet the Indicators That Make This Strategy Work
The strategy is built on the fusion of trend clarity and momentum confirmation. Here are the two TradingView indicators you need:
KAMA Clarity Trend Indicator
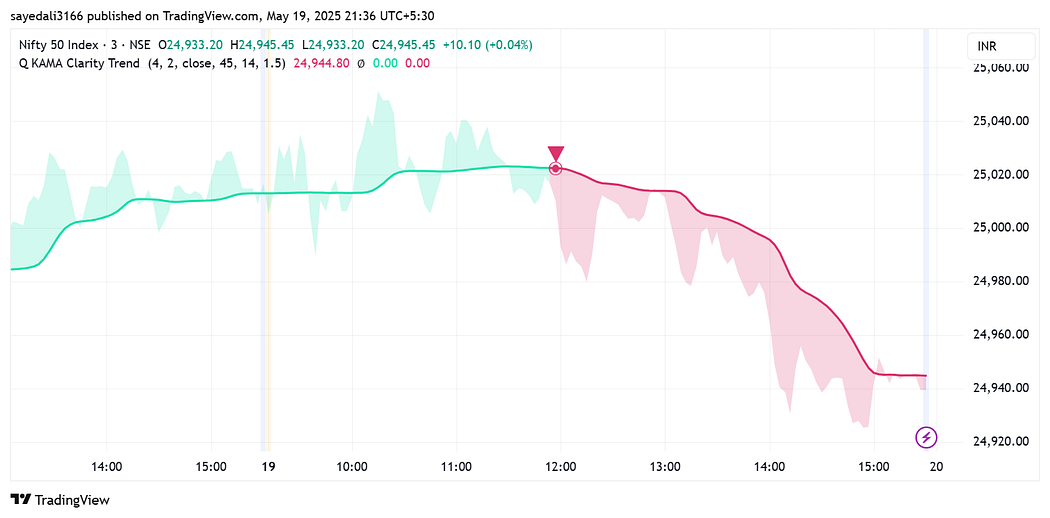
Purpose: Provides clear buy and sell signals.
Use Case: Entry confirmation based on bullish or bearish candle formations.
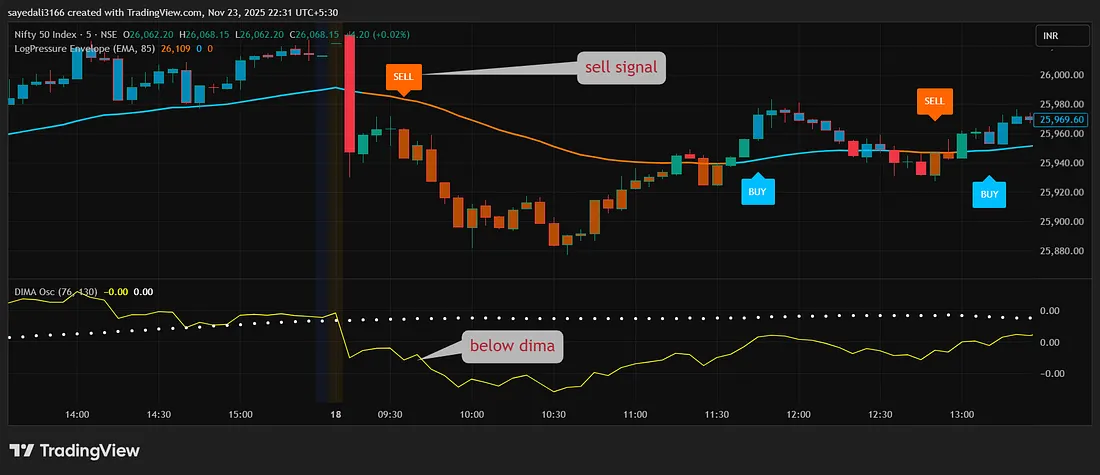
Visuals: Marked with green (buy) and red (sell) signals directly on the chart.
Extra Function: Also acts as your stop-loss guide (the KAMA line).
2. Long Short DOM Indicator
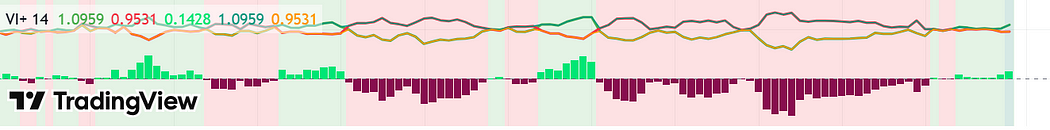
Purpose: Confirms market direction using histograms.
Visuals: Bullish histogram (green bars), bearish histogram (red bars).
Use Case: Must align with the Comma Clarity Trend to validate the trade.
Below are my new ebooks.

If you’ve ever felt lost in the chaos of market moves, it’s time to bring structure to your strategy. My new ebook, CPR MASTER CLASS, breaks down one of the most powerful tools in price action trading — Central Pivot Range — and shows you exactly how to trade with confidence, clarity, and consistency.
✅ Learn CPR, Virgin CPR, Camarilla, Volume, VWAP, and more
✅ Includes real chart examples, setups, and TradingView guides
✅ Instant download, lifetime access👉 Grab your copy now on Gumroad:
🚀 Ready to Supercharge Your Trading? 📈
If you’re tired of guesswork and want to trade confidently using advanced indicators that actually work, my ebook “Advanced Technical Indicators for Your Trading Journey” is exactly what you need!

👉 Click here to grab your copy on Gumroad now! 👈
BUY NOW 25 Intraday Trading Strategies in 2025
BUY NOW OPTIONS AND FUTURES FOR BEGINNERS 2025

15 INTRADAY TRADING INDICATORS
‘Stock Market for Beginners’ — Your ultimate guide to understanding the stock market from scratch! Learn essential terms, beginner-friendly strategies, and how to grow your wealth — no prior experience is needed
🎯 The Trading Setup: Step-by-Step
This isn’t just theory — this is a backtested, real-time applicable strategy that works on stocks, forex, crypto, indices, and more. The time frame should be 3 minutes.
✅ Sell Signal Setup
To take a short (sell) position:
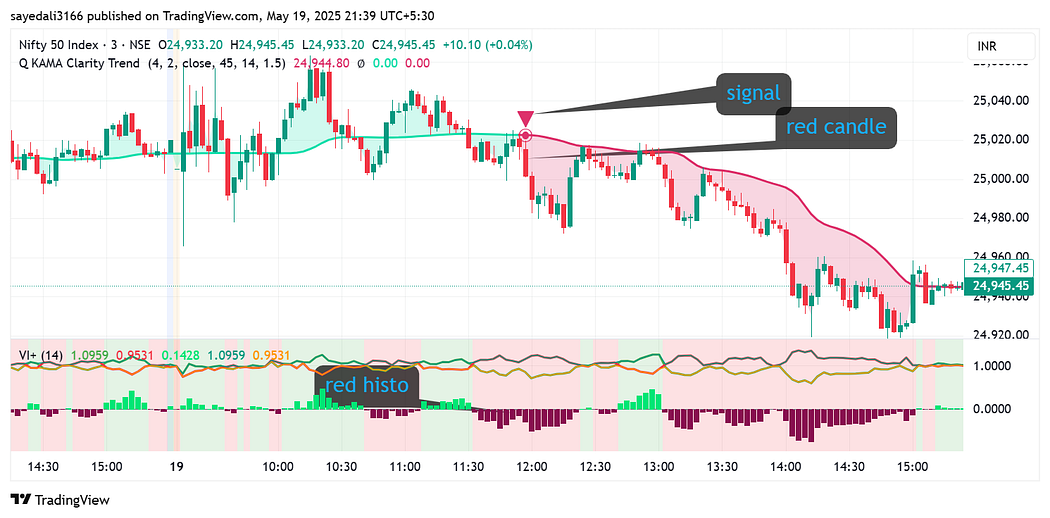
The KAMA Clarity Trend gives a sell signal.
A bearish candle must form on the chart.
The Long Short DOM histogram shows red bars (bearish momentum).
If all three conditions are met → Place a Sell Order.
Stop-loss: Just above the KAMA line from the trend indicator.
Target: 1:2 Risk-to-Reward ratio (i.e., for every ₹1,000 risked, target ₹2,000 profit).
✅ Buy Signal Setup
To take a long (buy) position:

The KAMA Clarity Trend gives a buy signal.
A bullish candle confirms the uptrend.
The Long Short DOM histogram shows green bars (bullish momentum).
If all three conditions are met → Place a Buy Order.
Stop-loss: Just below the KAMA line.
Target: Again, maintain a 1:2 Risk-to-Reward.
🧠 Simple Rule:
Only take trades when both indicators AND the candle formation agree.
🛠 How to Add the Indicators on TradingView
If you’re new to TradingView, here’s a quick guide to setting this strategy up:
Step 1: Add the Long Short DOM Indicator
Open TradingView.

Click on Indicators.
Search for Long Short DOM.
Select and apply it to your chart.
Step 2: Add the KAMA Clarity Trend Indicator
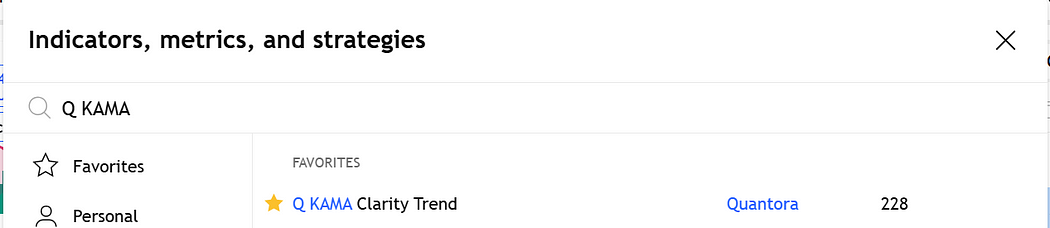
Again, click on Indicators.
Type KAMA Clarity Trend.
Apply it to your chart.
Now your setup is ready to scan for high-conviction trades.
🔑 Key Advantages of This Strategy
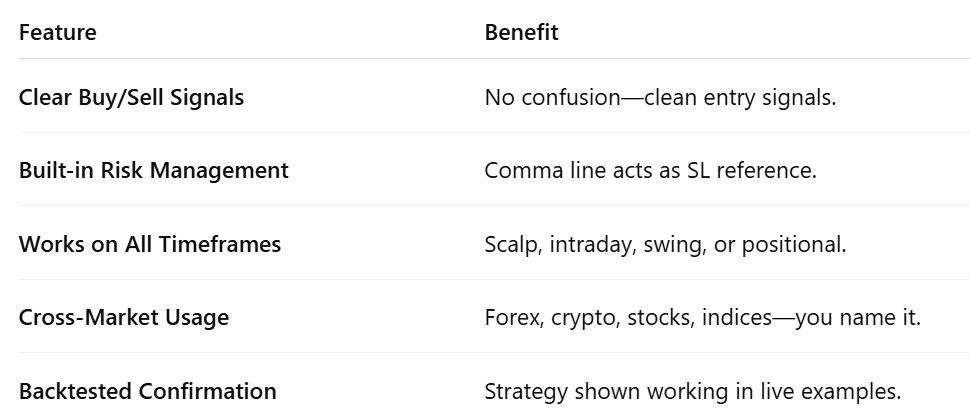
🧠 Pro Tips to Maximize Results
Avoid Trading During News Events: Volatility can break technical patterns.
Use a Journal: Log each trade and learn from both wins and losses.
Risk Only 1–2% per Trade: Stick to capital preservation.
Backtest Before You Go Live: Practice in paper trading mode first.
Look for Confluence: Use this with support/resistance, volume, or trendlines for better accuracy.
🧪 Backtesting the Strategy
Use TradingView’s Bar Replay Mode.
Apply the indicators.
Go candle by candle and record:
Entry point
Stop-loss
Target
Outcome (Win/Loss)
Aim for at least 50–100 trades before deciding on its consistency.
Before using real money, test this setup on historical charts:
❓FAQs
Q1: Can this strategy be used for options trading?
Yes, but it’s best used for identifying the underlying asset’s trend. Use it to decide option strikes/direction.
Q2: What is the best time frame?
It works across all timeframes, but 15-minute to 1-hour is recommended for intraday.
Q3: Is this 99% accurate always?
No strategy is 100% foolproof. The “99%” refers to high-probability signals when all conditions align perfectly.
Q4: Is this a repainting indicator?
From the test runs and community feedback, both indicators are non-repainting.
Q5: Can I use it on mobile?
Yes, TradingView’s mobile app supports both indicators.
💬 Final Thoughts
The difference between amateur and professional traders often lies in one word: Clarity.
The KAMA Clarity Trend + Long Short DOM combo gives you exactly that — crystal-clear entries, disciplined exits, and confidence in decision-making.
Don’t fall into the trap of overcomplicating your charts. Sometimes, simple setups, backed by data and confirmed by multiple tools, are all you need.
So next time you’re staring at your screen, unsure whether to buy or sell, this strategy might just be your answer.