
If you’re looking for a reliable and beginner-friendly intraday setup, then this article is for you. Whether you trade Forex, crypto, or stocks — this strategy works across markets. I tested it on the 5-minute GBP/JPY chart, and the results were impressive.
All you have to do is follow the indicator signals — no guessing, no second thoughts. Just discipline and a little bit of patience.
Let’s dive in and set this up step-by-step.
For more trading strategies check my website: Tradetalkshub.com
Below are my new ebooks.
🚀 Ready to Supercharge Your Trading? 📈
If you’re tired of guesswork and want to trade confidently using advanced indicators that actually work, my ebook “Advanced Technical Indicators for Your Trading Journey” is exactly what you need!

👉 Click here to grab your copy on Gumroad now! 👈
You’ll get instant access to proven strategies, step-by-step TradingView setups, clear buy/sell signals, and everything you need to transform your trading skills. Start making better, smarter trades today!
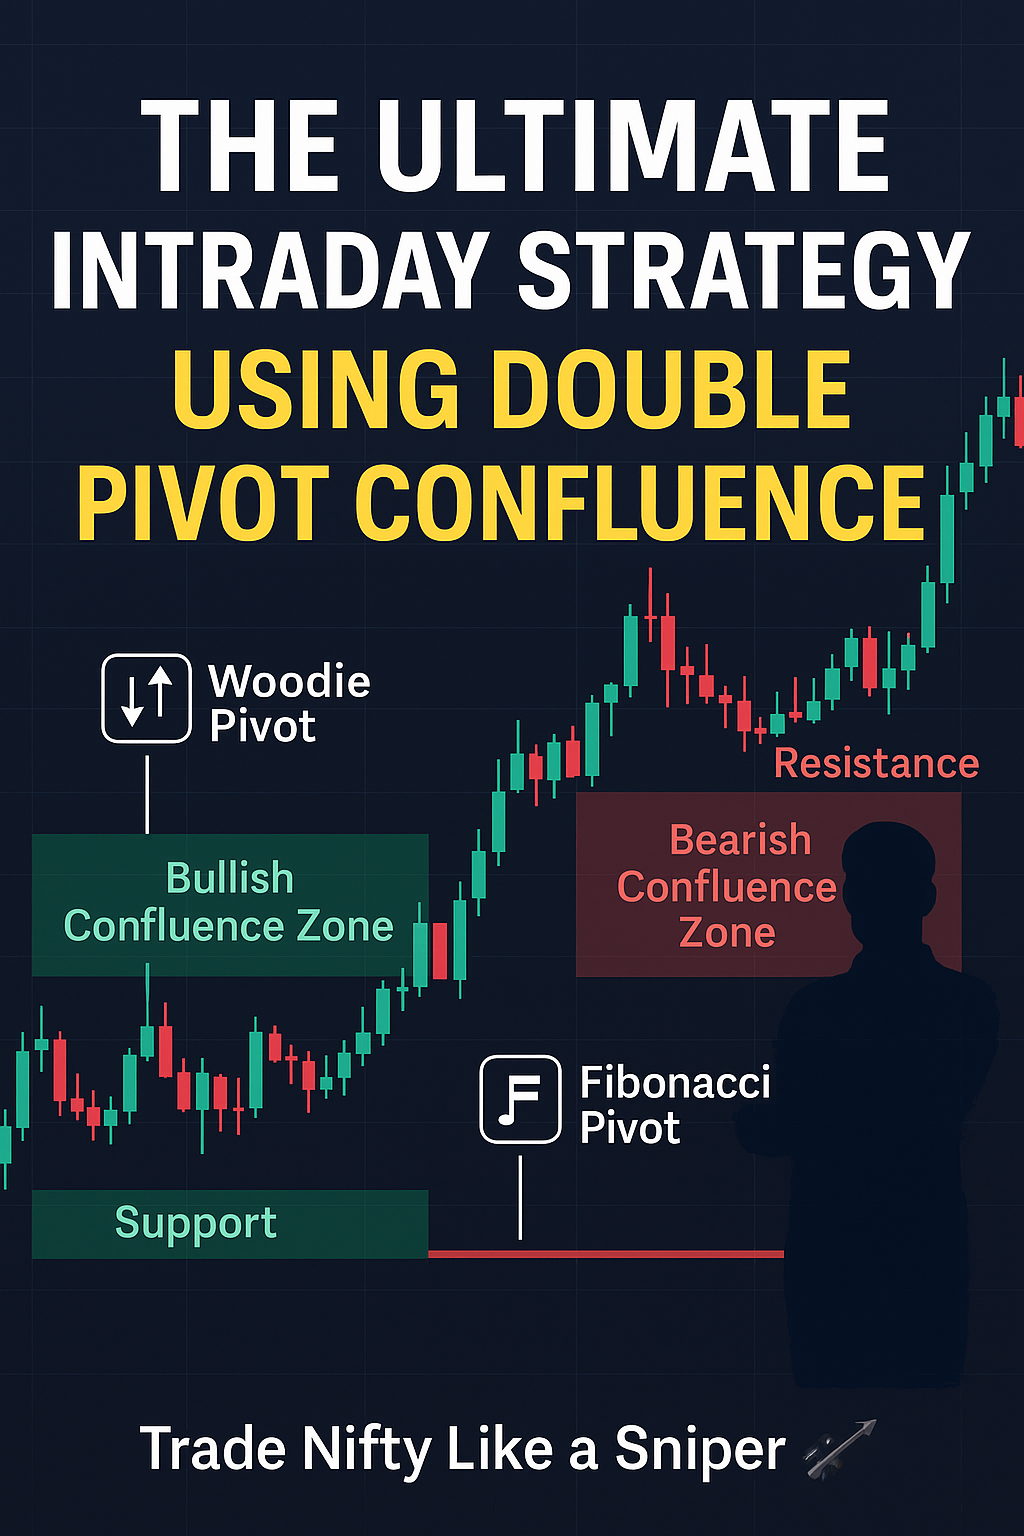
BUY NOW 25 Intraday Trading Strategies in 2025
BUY NOW OPTIONS AND FUTURES FOR BEGINNERS 2025

15 INTRADAY TRADING INDICATORS
‘Stock Market for Beginners’ — Your ultimate guide to understanding the stock market from scratch! Learn essential terms, beginner-friendly strategies, and how to grow your wealth — no prior experience is needed.
🎯 Indicators You Need:
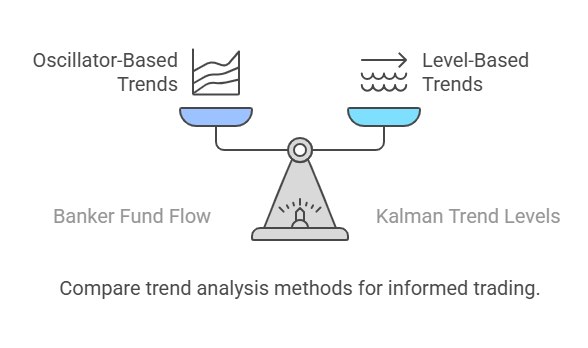
We’ll be using two powerful TradingView indicators:
- Banker Fund Flow — Trend Oscillator
- Kalman Trend Levels — by Big Beluga
These indicators work best when used together. One provides signals, and the other confirms the trend. That combo is what makes this setup solid.
🔧 How to Add the Indicators on TradingView:
- Open TradingView.
- Search for “Banker Fund Flow Trend Oscillator” and add the one by L3.
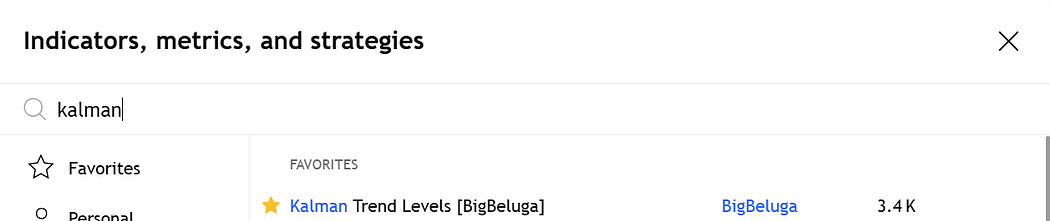
3. Now search “Kalman Trend Levels” and select the version by Big Beluga.
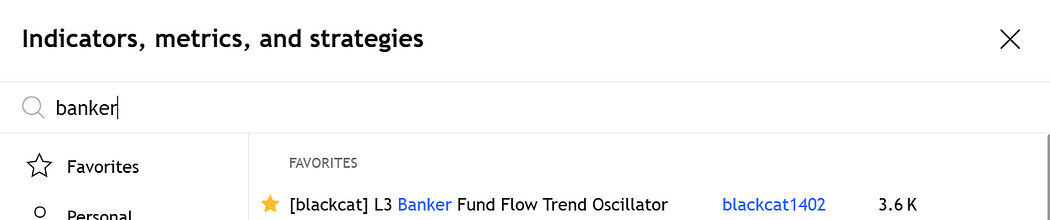
That’s it. Your chart is ready!
Timeframe used: 5-minute chart
Tested on: GBP/JPY
📈 Buy Conditions
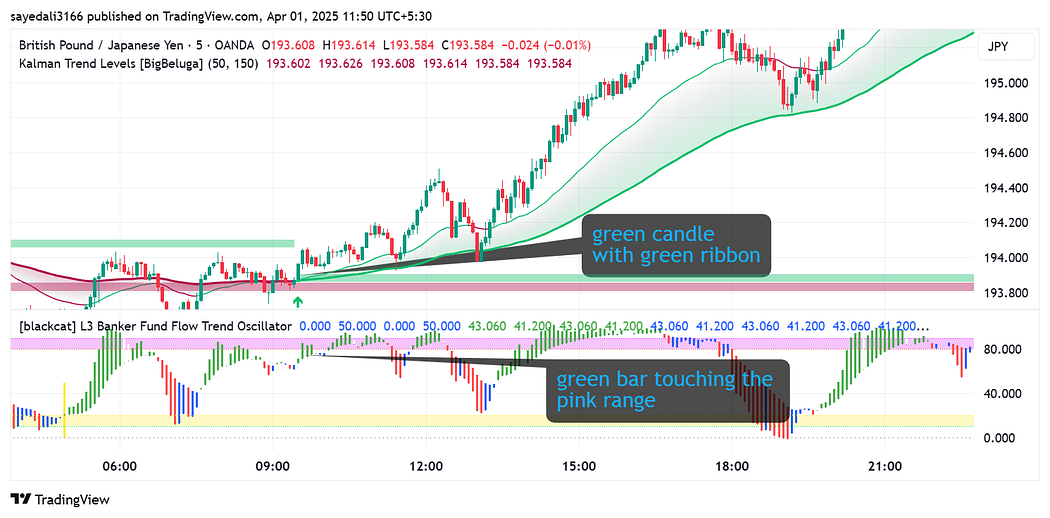
- Kalman Trend Levels gives a Buy Signal.
- A bullish candle is formed.
- Banker Fund Flow shows bullish candle bars (they confirm the trend).
✅ If all three conditions are met — take a Buy entry.
🎯 Stop Loss: Place it on the Kalman Long Line. 🎯 Target: Risk-to-Reward Ratio of 1:1.5.
Example: If your SL is 10 pips, aim for a 15 pips target.
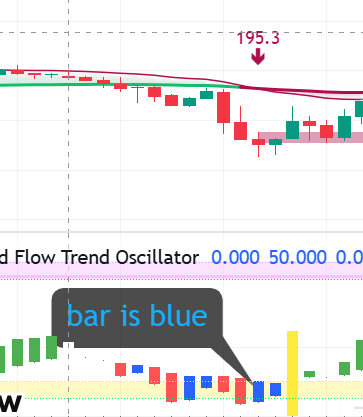
📉 Sell Conditions
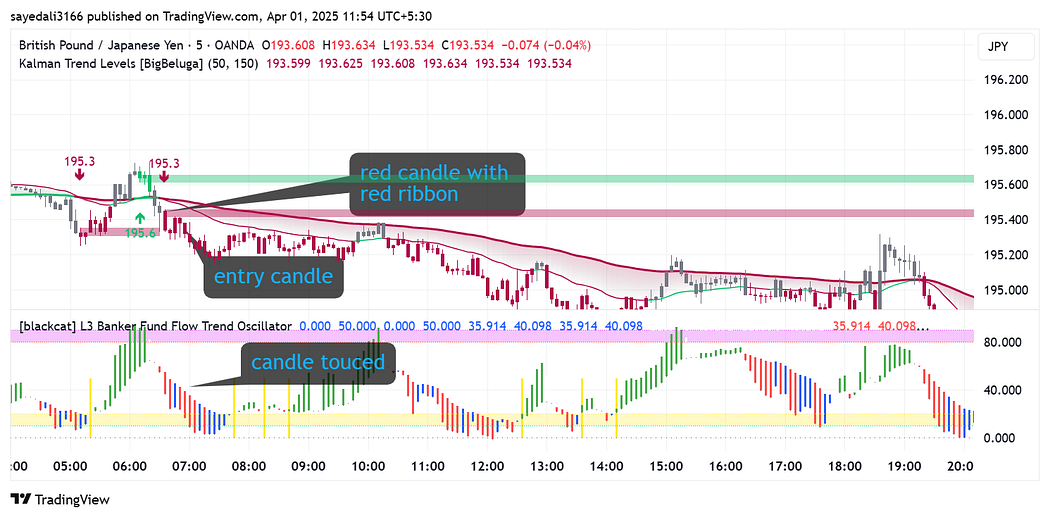
- Kalman Trend Levels gives a Sell Signal.
- A bearish candle is formed.
- Banker Fund Flow shows bearish candle bars (trend confirmation again).
✅ If all conditions are met — take a Sell entry.
🎯 Stop Loss: Same — place it at the Kalman Long Line. 🎯 Target: Risk-to-Reward Ratio of 1:1.5.
⚠️ Important Notes
- Not every trade will be a winner. Some will hit SL — and that’s completely normal.
- Stick to the rules. Don’t enter trades if even one condition isn’t met.
- Test this strategy for 5–6 days before you fully rely on it. That’s how you build confidence.
Where to avoid Trades
Strictly follow the rules
- If in a bullish scenario, the signal candle should be green, avoid if the candle is red
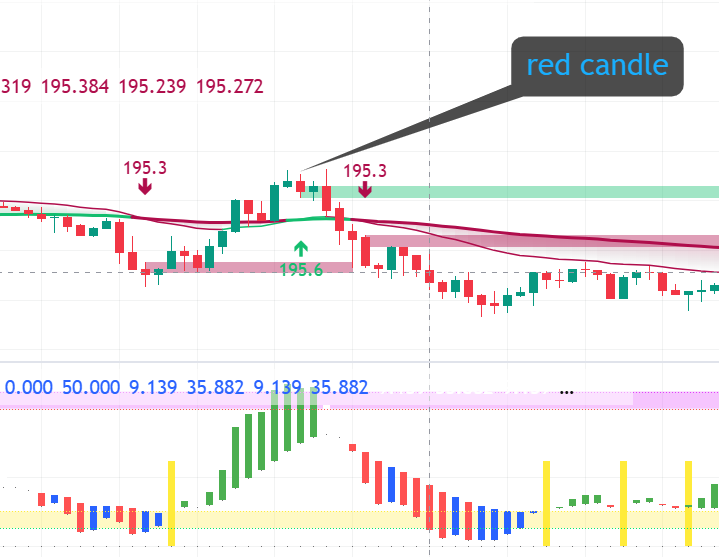
- In a bearish scenario, the oscillator candle should be red
✅ Key Takeaways
- Works on Forex, Crypto, Stocks, and Commodities.
- Use a 5-minute timeframe for scalping and intraday.
- Best for GBP/JPY, but feel free to experiment.
- Stick to 1:1.5 RR to maintain good risk management.
- Don’t expect a 100% win rate — but expect consistent results with discipline.
🚀 Final Words
This strategy is simple yet powerful. If you like indicator-based entries with trend confirmation, this one’s for you.
Give it 5 days. Follow it honestly. Track the results. And if it helps you, don’t forget to come back and comment below.