

MACD
If you’re searching for a powerful and simple Technical Trading Indicator that works across multiple timeframes and offers reliable buy and sell signals — especially for intraday trading — then this article is going to make your day. One of the most widely used and surprisingly effective technical indicators is MACD (Moving Average Convergence Divergence).

In this article, I’ll explain:
- How to use MACD like a pro
- What the default settings 12, 26, and 9 mean
- The difference between a moving average and the MACD
- What is considered a good MACD value
- Why the MACD setup shown in the image works so well
- How to use MACD for intraday trades
- Plus, I’ll share a few key tips and my own experience using it on the Nifty 50 Index
Let’s dive in.
Below are my new ebooks.
BUY NOW 25 Intraday Trading Strategies in 2025
BUY NOW OPTIONS AND FUTURES FOR BEGINNERS 2025
15 INTRADAY TRADING INDICATORS
‘Stock Market for Beginners’ — Your ultimate guide to understanding the stock market from scratch! Learn essential terms, beginner-friendly strategies, and how to grow your wealth — no prior experience is needed.
What is the MACD Indicator?
MACD is a momentum-based trend-following indicator that helps you identify bullish or bearish momentum. Momentum is very important for options trading, especially option buying. It was developed by Gerald Appel in the late 1970s and remains one of the most trusted indicators in modern trading.
It’s based on the relationship between two exponential moving averages (EMAs) and is displayed as a histogram that oscillates above and below a zero line. The MACD tells us when a trend is strengthening, weakening, or possibly reversing. If we can hold a trending position we can make good profits.
What Do the MACD Settings 12, 26, 9 Mean?
These numbers refer to the following:
- 12: This is the fast EMA — it reacts quickly to price changes.
- 26: This is the slow EMA — it smooths out price action.
- 9: This is the signal line — a 9-period EMA of the MACD line.
So the MACD Line = 12 EMA — 26 EMA, and the Signal Line = 9 EMA of the MACD Line.
When the MACD line crosses above the signal line, it indicates bullish momentum. When it crosses below, it suggests bearish momentum.
If you want to read a similar trading indicator click Here
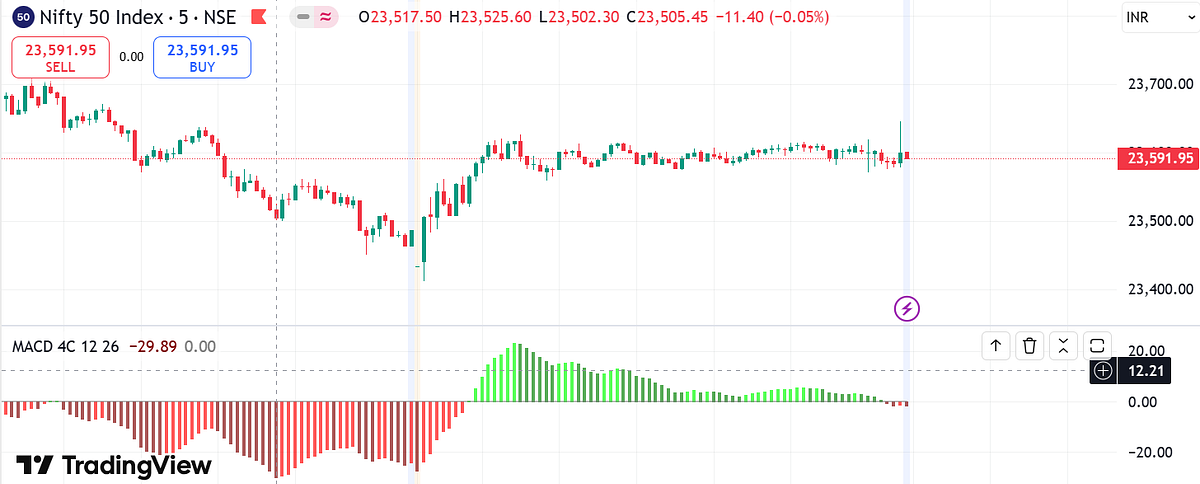
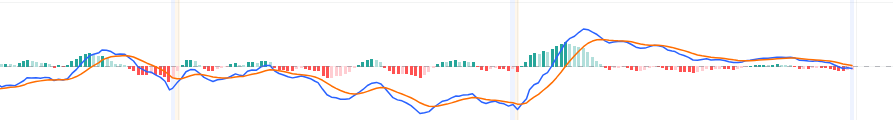
In the chart I’ve shared above, you can see these crossovers clearly visualized by the red and green bars in the histogram.
How to Add the MACD Indicator on TradingView
- Open your chart on Tradingview
- Click on Indicators.
- Search for MACD or MACD 4C.
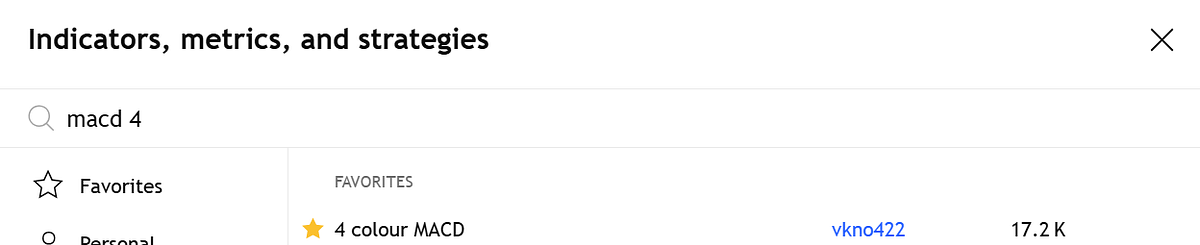
5. Select and add to the chart.
6. Adjust the settings to 12, 26, and 9 if not default.
What Is the Difference Between Moving Average and MACD?
This is a common question everyone thinks of. I will explain.
- A Moving Average (like 50 EMA or 200 SMA) simply plots the average price over a certain period.
- MACD, on the other hand, is a momentum oscillator based on the difference between two EMAs. It helps us visualize both trend strength and momentum direction.
Think of it like this:
- MA = trend direction
- MACD = trend + momentum + possible reversal
In other words, MACD gives you a more dynamic view of the market.
I will explain with an example
Ravi is a small shop owner running a local stationary store in Kerala. Like any businessperson, Ravi wants to keep track of his sales and make better decisions — when to stock more, when to run offers, and when business is slowing down.

He decides to use two simple tools to track his daily sales trends: Moving Average (MA) and MACD.
📈 Moving Average (MA): The Basic Sales Tracker
Ravi starts by calculating the 7-day moving average of his daily sales.
Let’s say over the past 7 days, his sales were:
Day 1: ₹1,000
Day 2: ₹1,200
Day 3: ₹1,500
Day 4: ₹1,100
Day 5: ₹1,300
Day 6: ₹1,600
Day 7: ₹1,400
So, the 7-day Moving Average is:
(1000 + 1200 + 1500 + 1100 + 1300 + 1600 + 1400) ÷ 7 = ₹1,300
This means Ravi’s average daily sales over the last 7 days is ₹1,300. Tomorrow, if his sales are more than ₹1,300, he knows business is improving. If it’s lower, things may be slowing down.

👉 This is what a Moving Average does: it smooths out daily ups and downs to show the overall trend.
⚡ MACD: The Sales Momentum Detector
Now Ravi wants to go one step ahead.
What if he could predict whether the sales trend is speeding up or slowing down?
That’s where MACD comes in.
He sets up a simple MACD formula based on two averages:
- A 12-day average (reacts quickly)
- A 26-day average (reacts slowly)
If the 12-day average (fast) moves above the 26-day average (slow), it means sales are accelerating.
If the 12-day average moves below, sales are losing momentum.
This is exactly what MACD does in trading — it compares two EMAs (Exponential Moving Averages) to detect momentum changes.
✅ Summary: MA vs MACD in Ravi’s Shop
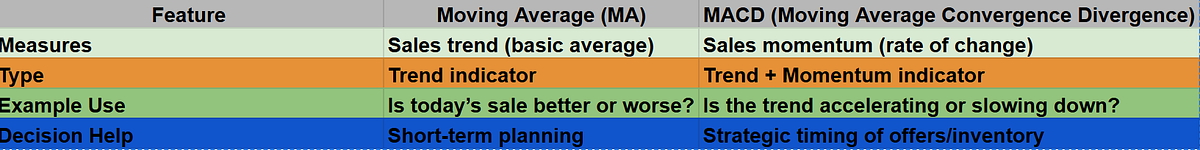
Now you understand the importance of the MACD tool in Trading.
Why Use the MACD Indicator Shown in the Image?
The MACD 4C (Four Color) version shown in the image is even more powerful. Here’s why:
- Color-coded histogram: Different shades of green/red represent the strength of the momentum.
- Quick glance clarity: You don’t need to analyze lines crossing each other. You can just read the color change.
- Better entry/exit signals: Especially when used with price action and support/resistance zones.
In the Nifty 50 Index chart above, notice how strong red bars start building before a major downtrend, and green bars show up right before the bounce. That’s actionable information.
What Is a Good MACD Value?
Many of us have the doubt about which is the best value.
There’s no single “good” MACD value like an RSI level (say 70/30). Instead, you focus on:
- Crossover of MACD and Signal Line
- MACD crossing the Zero Line
- Widening histogram bars: Indicates strengthening trend
- Shrinking bars: Trend weakening or possible reversal
Here’s a practical example:

- If MACD crosses above zero and bars go green → Consider it bullish.
- If MACD crosses below zero and bars go red → Consider it bearish.
This method has saved me from many false breakouts, especially during choppy intraday sessions.
How I Use MACD for Intraday Trading
I usually trade on the 5-minute or 15-minute chart. Here’s my simple setup:
📌 My Intraday MACD Strategy:
- Wait for the market to settle after the first 15–30 minutes.
- Add MACD with 12, 26, and 9 settings (or MACD 4C version).
- Look for histogram color changes with price near key levels (previous day high/low, VWAP, etc.).
- Confirm with price action (engulfing candle, breakout candle, etc.)
- Enter a trade when:
- MACD bars go from red to green = LONG
- MACD bars go from green to red = SHORT
6. Exit when the histogram starts shrinking or reverses color.
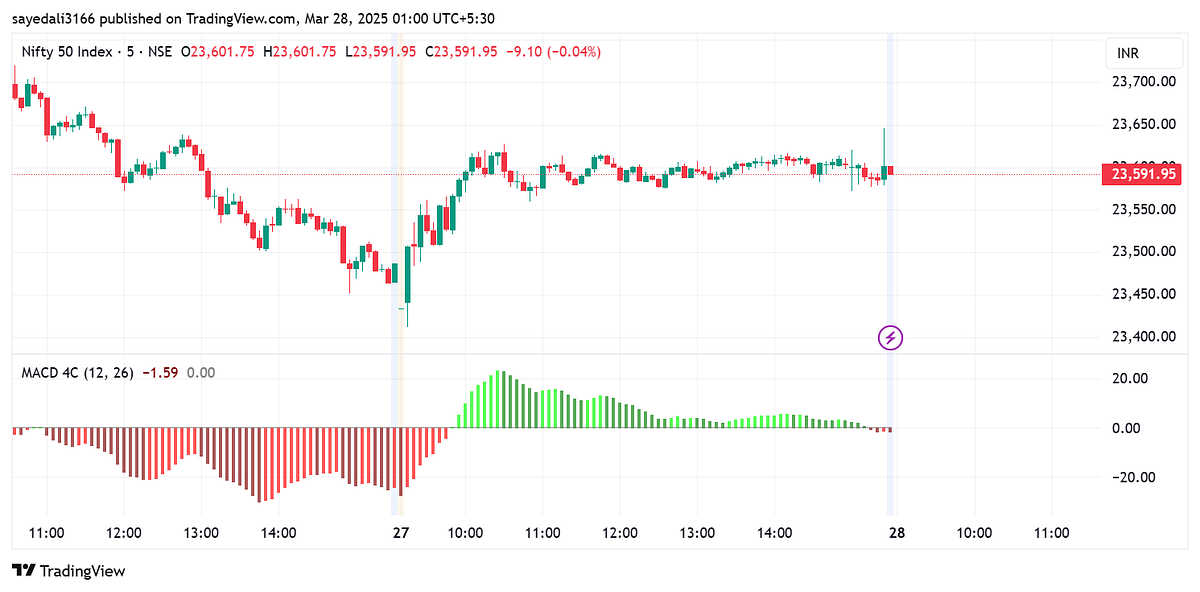
Example:

In the chart above, around the middle of the 27th March session, MACD turns green with rising bars while the price starts forming higher lows. That’s your cue to go long.
Key Points to Remember:
- MACD works best in trending markets. Avoid using it alone in sideways conditions.
- Use with confluence — EMA levels, support/resistance, VWAP.
- Combine MACD with candlestick patterns for more accurate entries.
- The 0-line crossover is a strong confirmation of the trend shift.
- Always manage risk with proper stop-loss (use recent swing high/low).
- You don’t need to predict tops and bottoms — just ride the momentum wave with MACD.
MACD vs RSI — Quick Thought
Some traders ask if MACD is better than RSI. I say both have their uses:
- MACD = Trend & Momentum
- RSI = Overbought/Oversold Conditions
If I had to choose just one, I’d stick with MACD. It’s more versatile and gives earlier signals in many cases.
Final Conclusion
MACD is like that old, reliable friend in trading. It doesn’t promise overnight riches, but if you understand it well and pair it with your own market view — it delivers.
The best part? It’s free on almost every charting platform including TradingView. The image you saw above is from my own TradingView chart using the MACD 4C version, which I highly recommend for clarity and visual confirmation.
Whether you’re a beginner or a seasoned trader, this indicator deserves a place in your strategy toolbox.