
In the fast-paced world of day trading strategies and scalping, precision and timing are everything. You’re constantly walking the tightrope—entering early to ride explosive moves while shielding yourself from false signals that can derail your profit. This is where a robust, momentum-based filter like the Trend Intensity Index (TII) shines, especially when paired with the Correlated Movement Indicator V2, which helps define meaningful swing points. That structure + momentum combo is gold in the realm of intraday trading tips and scalping strategy success.
In this deep-dive, we unpack exactly how to build this strategy—from setting up your indicators on TradingView to entry rules, trade management, risk controls, and advanced enhancements.
1. The Trend Intensity Index (TII): Your Momentum Filter

The Trend Intensity Index (TII) is a potent, momentum-based oscillator designed to reveal the current market bias—bullish or bearish. It ranges from 0 to 100, much like RSI or Stochastic, but its value lies in its ability to confirm who’s in control:
- Above 50 = bullish strength
- Below 50 = bearish pressure
- 0–20 = very strong bearish momentum
- 80–100 = very strong bullish momentum
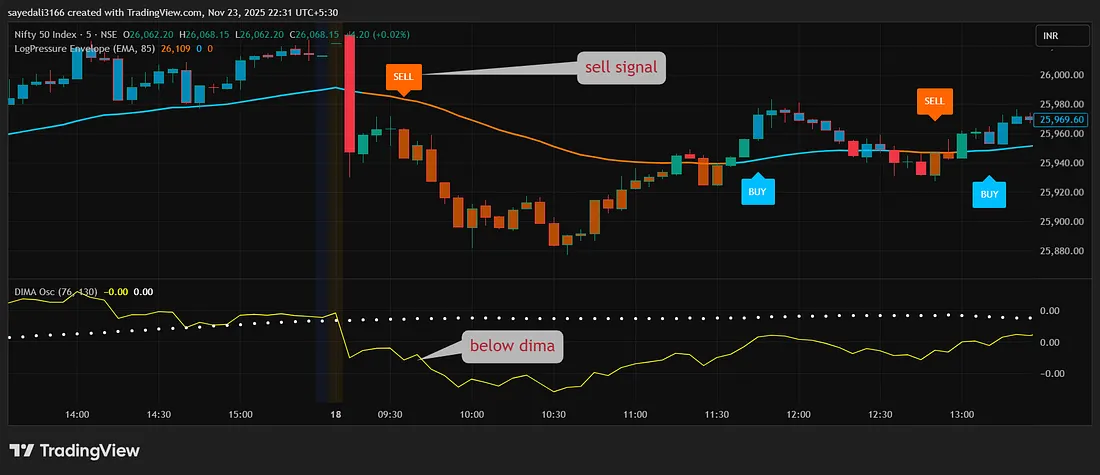
On charts (like TradingView), TII typically uses color cues:
- Green = bullish zone
- Red = bearish zone
- Orange = neutral or transition
Why this matters: you’re not guessing—you’re aligning trades with clear momentum signals, reducing false entries significantly.
2. Correlated Movement Indicator V2: Marking Swing Structure

The Correlated Movement Indicator V2 adds structure by labeling critical price action points:
- HH (Higher High) → bullish momentum continues
- HL (Higher Low) → bullish pullback strength
- LH (Lower High) → weakening bulls
- LL (Lower Low) → bearish dominance
Combining these swing markers with TII’s color-coded momentum keeps you firmly rooted in structure + momentum—a powerful pillar in scalping.
3. The Strategy Blueprint: Entry Rules
** BUY RULE**

- A Higher Low (HL) appears
- That candle closes green
- TII is green (above 50)
Together, they confirm structural support + momentum alignment. That’s your signal to enter.
** SELL RULE**

- A Higher High (HH) appears
- Candle closes red
- TII is red (below 50)
This signals a potential top or retracement—your cue to short.
4. TradingView Setup: Tools for Scalping & Intraday


- Add Indicators:
- TII – Length typically 60; optimize between 30–80; optional extreme zones at 20 & 80
- Correlated Movement Indicator V2 – ensure HH/HL/LH/LL labels visible
- Chart Timeframes:
- Scalping: 5-minute charts
- Intraday: 15-minute charts
- Optional: 1-hour for swing context (ties into multiple time frame analysis)
5. Entry Conditions in Practice
Buy setup:

- HL appears
- HL candle is bullish (green)
- TII > 50 (green)
- Enter at candle close or next open
Sell setup:

- HH appears
- HH candle is bearish (red)
- TII < 50 (red)
- Enter at close or next open
6. Risk Management: Stop Loss & Profit Targets
Essential for scalping strategy and day trading strategy discipline:
- Buy Stop Loss: below the HL candle or nearest swing low
- Buy Target: prior swing high or at 1:2 R:R
- Sell Stop Loss: above HH candle or nearest swing high
- Sell Target: prior swing low or 1:2 R:R
- Pro Tip: If TII fades into neutral or opposite color, consider early exit
7. Add-On Filters: Sharpen Accuracy
Boost precision with additional layers:
- EMA Filter: Only ban longs when price is below 50 EMA; avoid shorts when above
- Volume Confirmation: Entry candle must have volume exceeding preceding few candles—spike indicates real participation
- Time-of-Day: For forex/crypto, best trades during London + New York overlap; for equities, first 2 hours post-open
8. Psychology & Discipline: No FOMO, Only Signals
Common pitfalls:
- Entering too early
- Chasing weak momentum
- Ignoring structure, trading on emotion
This strategy solves them:
- Only trade on HL + momentum
- Only short on HH + momentum weakness
- No randomness, no emotional entries
That builds disciplined execution—not emotional reaction.
9. Strengths & Weaknesses: Balanced View
Strengths
- High accuracy when trend is in motion
- Visual clarity via colors and swing labels
- Adaptable to scalping and intraday
- Filters out random signals
Weaknesses
- Can lag in sideways ranges
- Swing markers (HH/HL) can repaint depending on script
- Fewer trades—requires patience
Remedies
- Use trend filters like EMA or higher timeframe confirmation
- Combine with volume or bounce strategies
10. Backtesting & Optimization: Data-Driven Edge
- Backtest 100+ trades per asset
- Test TII length variants (30, 60, 80)
- Try across timeframes: 5m, 15m, 1h
- Track: win rate, average risk-reward, max drawdown
- Consider automating with basic algorithmic trading via TradingView alerts or bots
11. Multi-Timeframe Confirm: Aligning Macro & Micro Trends
Support decisions using multiple timeframes, a classic multiple time frame analysis technique:
- Higher timeframe (e.g., 1h) for trend direction
- Lower timeframe (5m or 15m) for entries
Helps avoid countertrend trades and improves trade quality.
12. Practical Risk Management & Mental Game
No strategy survives without mental fortitude and proper money management:
- Risk just 1–2% per trade
- Avoid slow low-liquidity periods
- Stop trading after 3 consecutive losses—reset your mindset
13. Key Takeaways: Recap the High-Probability Framework
- TII filters momentum direction
- HL + green + TII green → high-probability buy
- HH + red + TII red → high-probability short
- Always enforce stop loss + defined risk-reward
- Enhance with EMA, volume, time-of-day, and multi-timeframe analysis
- Backtest extensively and consider algorithmic deployment
14. Final Insights: Trade with Purpose, Not Guessing
Success in trading isn’t about perfect predictions—it’s about consistent, disciplined application of high-probability setups. The TII + Swing Points strategy takes emotion out of the equation, blending structure and momentum—two pillars of sustainable success. Fewer trades, yes—but smarter, accurate ones.
Pro Tip: Apply across markets—crypto (ETH, BTC), equity indices (Nifty Bank), forex pairs, even commodities. Structure and momentum remain universal.