
Simple Intraday Trading Strategy
If you are looking for a scalping strategy this article is for you. The scalping method is not suited for some traders. Scalping requires quick action. Buy and sell in minutes. So if you have a skill in scalping this article may find helpful.
Intraday Trading
Intraday trading means trading within a day. Buy and sell in a day. Suppose you buy a stock you should close your position before the market closes. For Intraday trading, you need a broker platform. Based on the country you are trading you can choose the broker.
You can use platforms like Dhan Broker, upstox, and zerodha. Check which platforms give you the leverage..
This strategy helps identify trend pullbacks and enter trades with high-probability setups at key support and resistance levels.
Ready to transform your financial future and dominate the stock market? Whether you’re a beginner looking to take your first steps or a trader hungry for proven strategies, I’ve got you covered!
📘 ‘Stock Market for Beginners’ is your ultimate guide to understanding the market from scratch. Learn essential terms, beginner-friendly strategies, and how to start growing your wealth — no experience needed!
📗 ’25 Intraday Strategies in 2025‘ is packed with powerful, easy-to-follow setups designed to maximize your trading profits this year. From quick scalps to trend-following techniques, this book gives you the edge to crush the markets like a pro.

🚀 Don’t miss this opportunity to supercharge your financial journey. Get both ebooks now on Gumroad and start building your path to success today!”
Indicators Setup
- Scalping Pullback Tool R1 (by Uncle L)
- Heikin-Ashi Candles (for smoother trend identification)
- Camarilla Pivot Points (for support and resistance zones)
- RSI (Relative Strength Index) — Default settings
- Stochastic Oscillator — K % = 7, Smoothing K % = 34
Understanding the Indicator Components
Scalping Pullback Tool R1
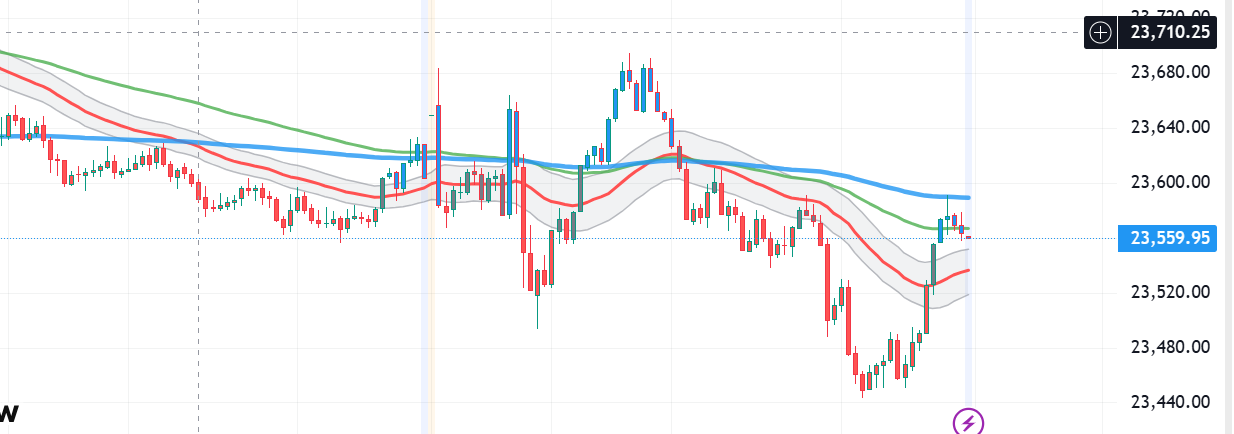
- Fast EMA (Green Line) — EMA (89)
- Medium EMA (Blue Line) — EMA (200) → Identifies overall trend
- Slow EMA (Black Line) — EMA (600) → Confirms long-term trend
- Price Action Channel (PAC) — 34 EMA-based dynamic channel
- Fractals & Market Structure — Detects higher highs, higher lows, and lower lows
Camarilla Pivot Points
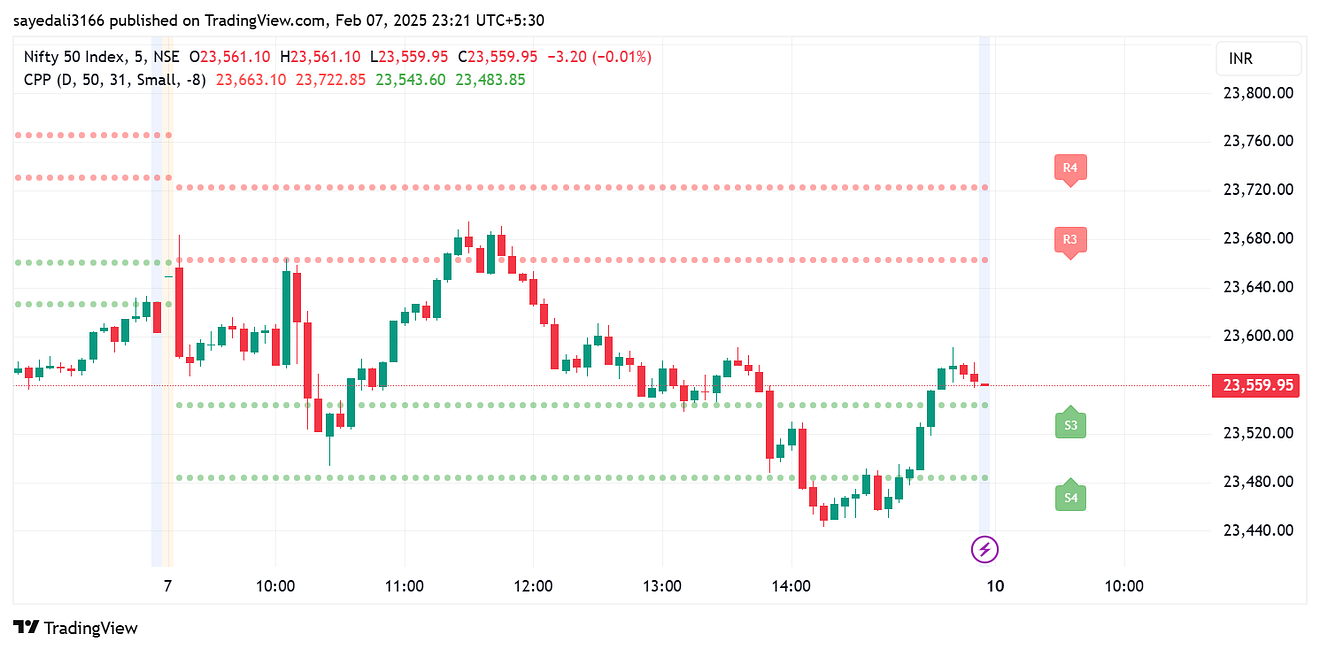
- R3 ,R4— Key resistance levels
- S3,S4— Key support levels
- Pivot Point (PP) — Midpoint of price action
How to add the Indicators
To apply the Scalping Pullback + Camarilla Pivot Strategy in TradingView, follow these steps:
Step 1: Add the Scalping Pullback Tool R1
- Open TradingView and select your preferred chart.
- Click on Indicators (🔍 icon at the top).
- Type “Scalping Pullback Tool R1” in the search bar.
- Select the one created by JustUncle L and add it to your chart.
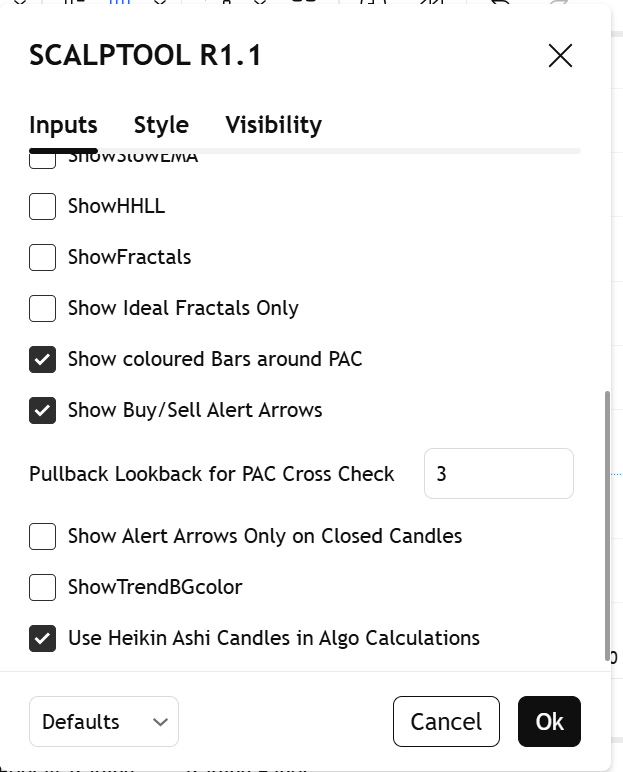
- Click the style tab:
- Untick the fractals
Step 2: Add Camarilla Pivot Points
- Click on Indicators again.
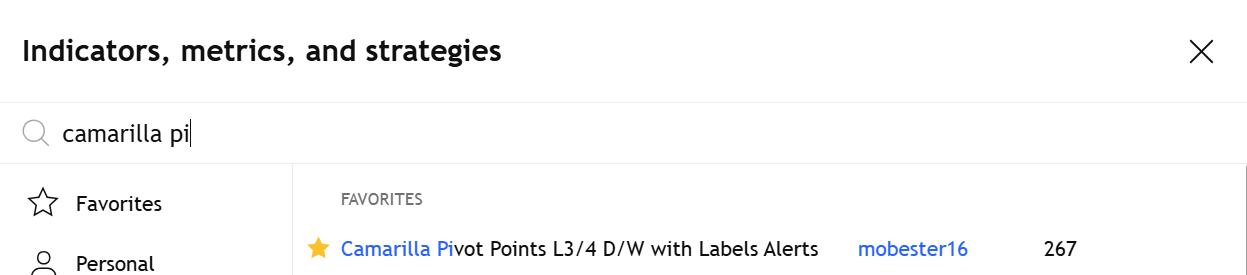
- Search for “Camarilla Pivot Points”.
- Select any reliable Camarilla indicator
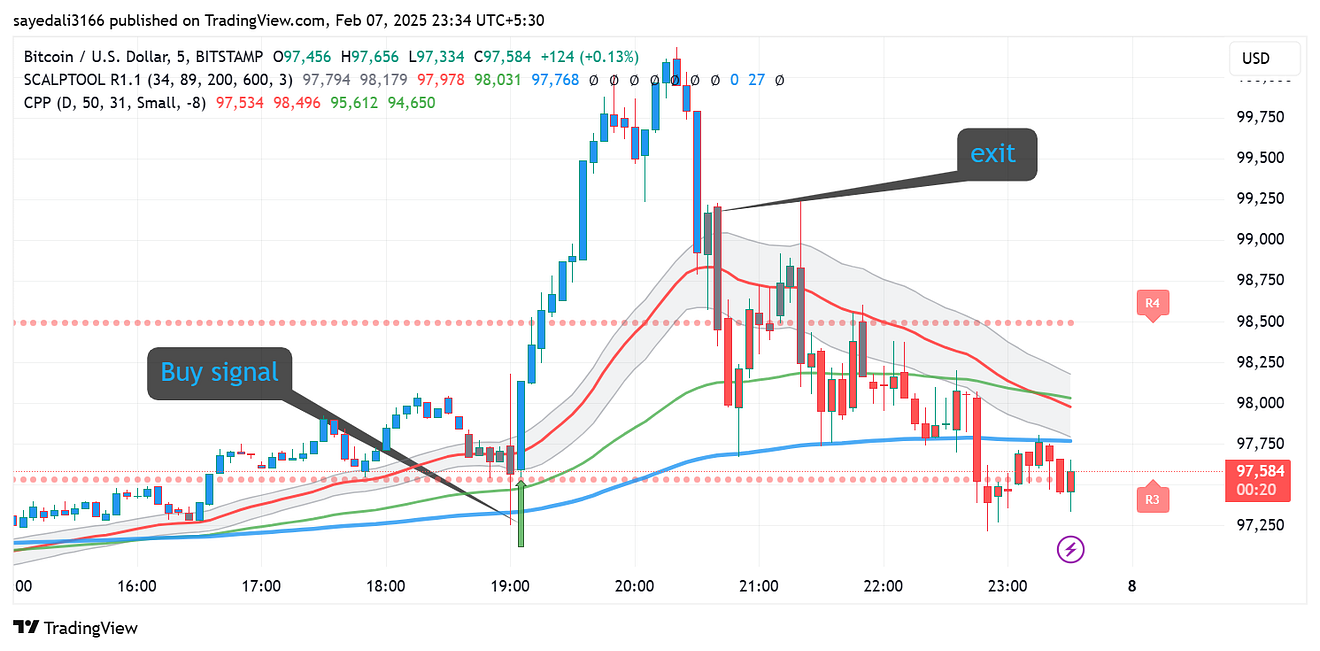
🔵 Buy Entry Conditions (Long Trade)
✅ Trend Confirmation:
- Candle is above the 200 EMA (blue line), confirming an uptrend.
- 600 EMA (black line) is below the price, confirming long-term bullish momentum.
✅ Pullback to PAC (Price Action Channel):
- Price retraces back to the PAC (Price Action Channel) after an uptrend.
- The candles remain blue, indicating an uptrend continuation.
✅ Camarilla Pivot Confirmation:
- Price pulls back near S3 and shows signs of reversal.
- A strong bullish candle forms near these support levels.
✅ Entry Trigger:
- A breakout candle closes above the PAC after consolidation.
✅ Stop Loss & Take Profit:
- Stop Loss: Below the recent higher low or the S3 level.
- Take Profit: Next Camarilla resistance level R3
- Trail Stop Loss: Move SL to break even once the price reaches R1.
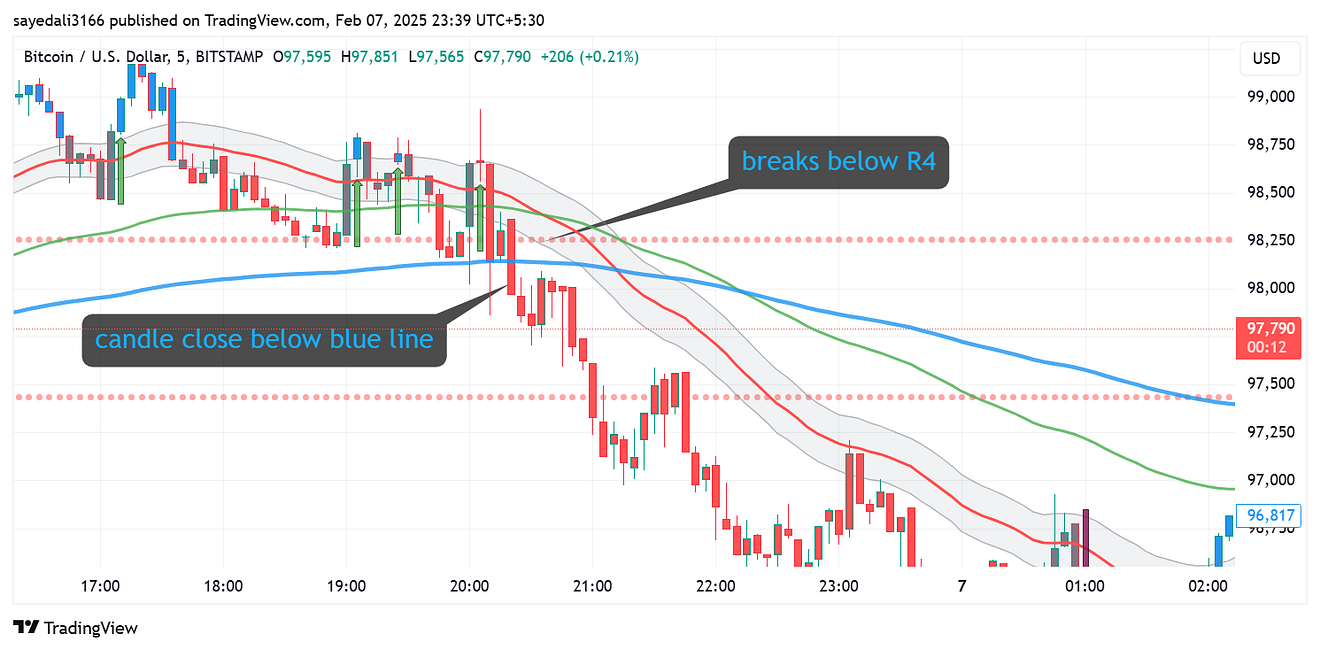
🔴 Sell Entry Conditions (Short Trade)
✅ Trend Confirmation:
- Candle is below the 200 EMA (blue line), confirming a downtrend.
- 600 EMA (black line) is above the price, confirming long-term bearish momentum.
✅ Pullback to PAC (Price Action Channel):
- Price retraces back to the PAC (Price Action Channel) after a downtrend.
- The candles remain red, indicating a downtrend continuation.
✅ Camarilla Pivot Confirmation:
- Price pulls back near R3 and shows signs of rejection.
- A strong bearish candle forms near these resistance levels.
✅ Entry Trigger:
- A breakout candle closes below the PAC after consolidation.
✅ Stop Loss & Take Profit:
- Stop Loss: Above the recent lower high or the R3 level.
- Take Profit: Next Camarilla support level ( S4).
- Trail Stop Loss: Move SL to break even once the price reaches S1.
⚠️ Additional Key Points
🔹 Avoid trading in a choppy/ranging market (if the price is moving sideways around the 200 EMA).
🔹 Ignore buy signals in a downtrend & sell signals in an uptrend to stay aligned with the main trend.
🔹 Heikin-Ashi candles filter noise, so stick with this chart type.
🔹 Volume confirmation can add extra confidence (stronger moves usually have a higher volume).
The Scalping Pullback + Camarilla Pivot Strategy is a powerful combination that leverages moving averages, price action channels, and pivot levels to identify high-probability trades. By trading pullbacks in the direction of the trend, you increase the chances of success while avoiding low-quality trades in choppy markets.
No strategy is foolproof, so always backtest and practice on a demo account before using real capital. Also, consider combining this setup with volume analysis or additional confirmations for even better results.
📢 Disclaimer:
Trading involves significant risk, and past performance does not guarantee future results. This article is for educational purposes only and should not be considered financial advice. Always conduct your own research before making trading decisions.