

RSI and MACD Trading
If you are tired of analyzing MACD and RSI indicators in different time frames then this article is for you. This indicator helps me with time-saving. If I am using a chart with a time frame of 5 minutes the RSI & MACD shows only the signal of that 5-minute time frame. Analyzing a higher time frame is best for entering into buy or sell decisions.
In this article, I will explain a technical indicator that helps you to make decisions in higher time frames.
Let’s get into the strategy.
How to Add the Indicator to Your Chart
Adding the indicator to your trading chart is a straightforward process. Here’s a step-by-step guide to help you set it up, whether you’re using TradingView or another popular charting platform.
1. Open Your Charting Platform
- Launch your preferred charting software or website (e.g., TradingView, MetaTrader, Thinkorswim).
2. Select the Asset to Trade
- Choose the stock, index, or asset you want to analyze. You can do this by searching for the asset in the platform’s search bar.
3. Access the Indicator Menu
- Look for the “Indicators” or “Studies” button, usually located at the top of the chart interface. Click on it to open the indicators menu.
4. Search for “Multi timeframe Rsi macd”
- In the search bar of the indicators menu, type “Multi timeframe Rsi macd.” This will filter the available indicators.
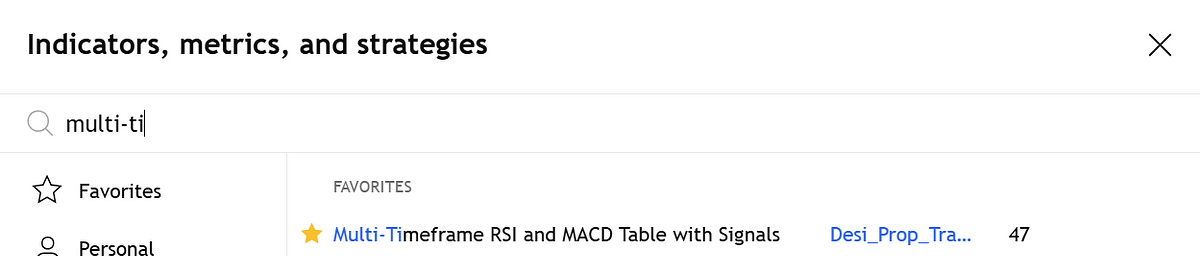
5. Add the Indicator
Once you find the indicator in the list, click on it to add it to your chart.
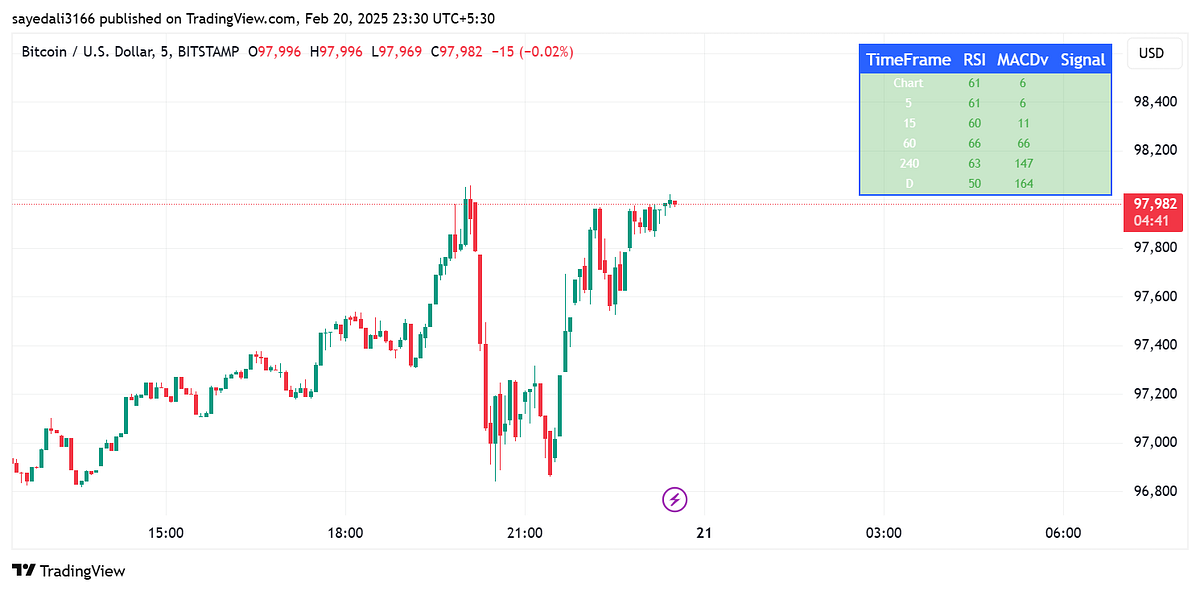
after you add the indicator your chart looks like the below image.
Indicator Categories
RSI
RSI is a momentum oscillator that measures the speed and change of price movements. Key Levels:
- Above 70: Considered overbought — prices may have risen too quickly, signaling a potential reversal or pullback.
- Below 30: Considered oversold — prices may have dropped too far, hinting at a possible bounce.
- 50: Often a neutral midpoint, though some traders watch for crosses above or below it as trend confirmation.
Moving Average Convergence Divergence (MACD)
MACD is a trend-following momentum indicator. It tracks the relationship between two exponential moving averages (EMAs) of an asset’s price, helping traders spot changes in trend direction, strength, and momentum.
- Key Signals:
- Bullish Crossover: MACD Line crosses above the Signal Line — potential buy signal.
- Bearish Crossover: MACD Line crosses below the Signal Line — potential sell signal.
- Zero Line: MACD crossing above zero indicates bullish momentum (short EMA > long EMA); below zero is bearish.
- Histogram: Widening bars show increasing momentum; narrowing bars suggest a slowdown or reversal.
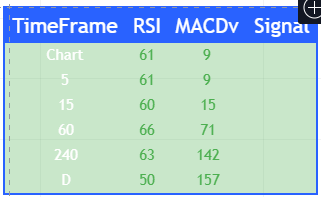
My Trading Setup with the Multi timeframe Rsi Macd
This indicator displays a table showing different time frames and corresponding RSI levels and MACD levels. It’s easy to get the RSI levels with this one indicator. I will share with you how I use this indicator for trading.
How I use this tool to trade BTC
First I will check the direction of trade. Is the asset in an uptrend or downtrend?
- If in an uptrend → I plan a buy trade.
- If in a downtrend → I plan a sell trade.
Buy Conditions
If the below conditions are met I will go for a long position
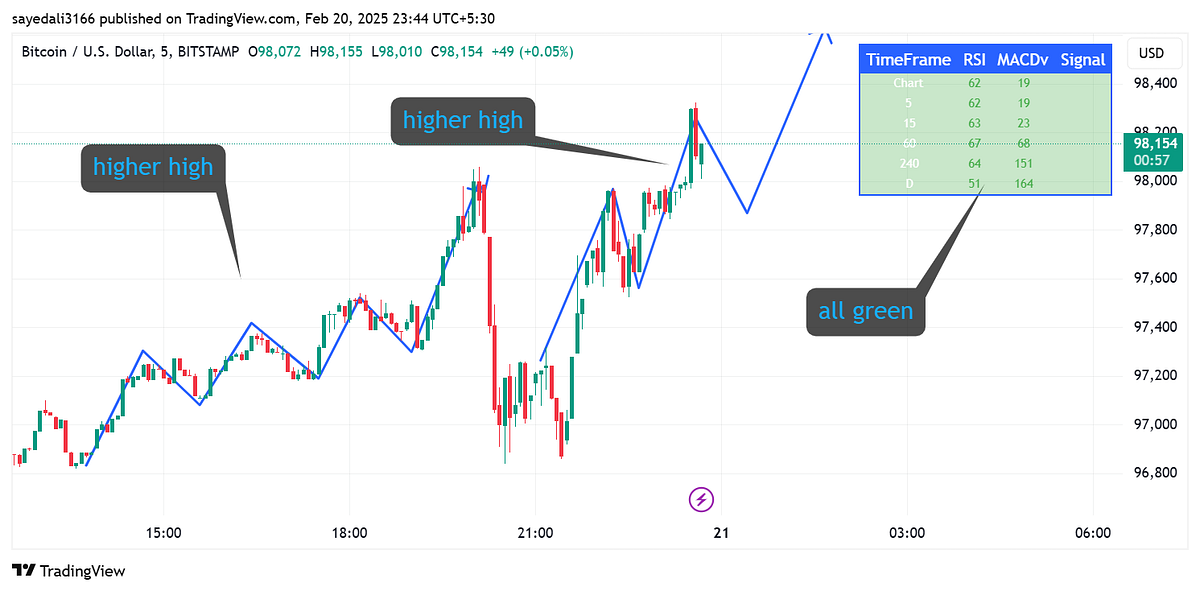
- The asset should be forming higher highs (uptrend).
- At least 4 time frames should show green RSI/MACD signals.
Sell Conditions
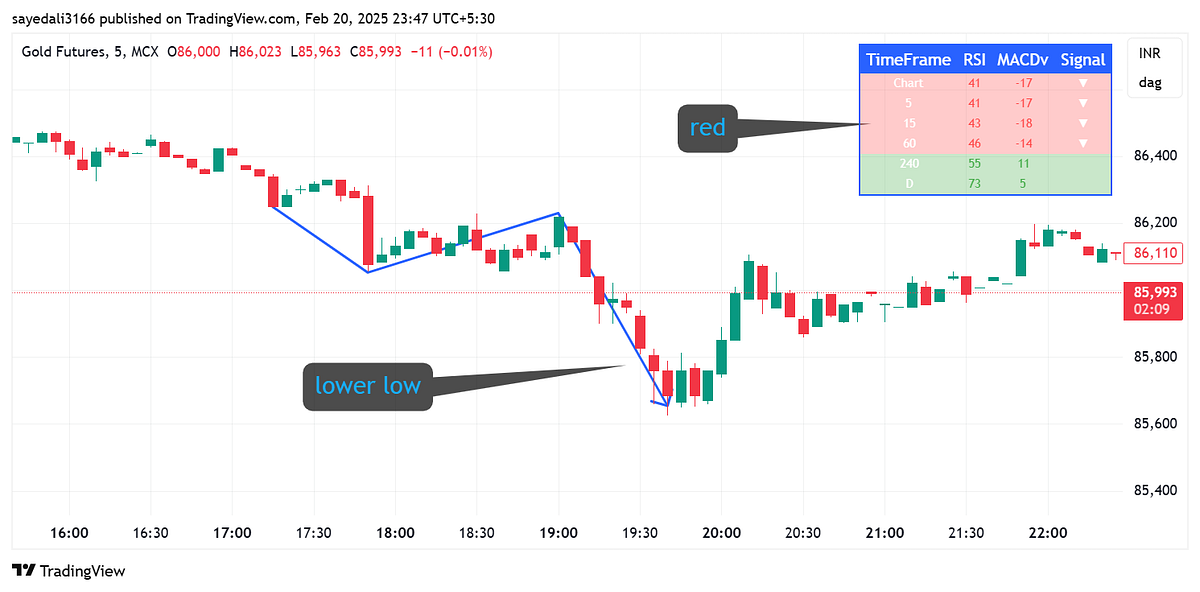
- The asset should be forming lower lows (downtrend).
- At least 4 time frames should show red RSI/MACD signals.
Conclusion
Do not rely purely on this indicator dashboard. your trade should be based on your other setup. these are data. we can analyze and enter a trade based on the confirmation of your other setup. Trading is risky.
check for below for my previous article about trading strategy.
This One Indicator Will Transform Your Trading Game. Find Out How!
If you are tired of using more technical indicators this article is for you. I used more technical indicators to take a…medium.com
The Premium Secret Bollinger Band Strategy No One Talks About
Discover a unique approach to Bollinger Bands that experienced traders keep to themselvesmedium.com