
If you’re looking for a more refined trading strategy this article is for you.
Today, I’ll cover a strategic combination using the Trend Signal with TP and SL indicator along with Floor Pivots with Camarilla Levels.
My favorite indicator is CPR. By combining camarilla levels with CPR my confidence of winning will boost up. This approach is particularly effective for intraday trading and allows you to identify clear buy and sell signals, incorporate dynamic support and resistance levels, and maintain proper risk management for better trade outcomes.
I already published an article about CPR. If you need more info read HERE.
If you don’t have enough time I just brief it for you…..
- CPR — To understand trends and potential reversals.
- Camerilla Levels — For identifying strong support (S3, S4) and resistance (R3, R4) areas.
Let’s Dive into the Strategy!
Step 1: Setting Up the Indicators
To get started, you’ll need to add the following indicators to your TradingView chart. You can use either the free or paid version of TradingView for this setup.
- Add the Trend Signal with TP and SL Indicator
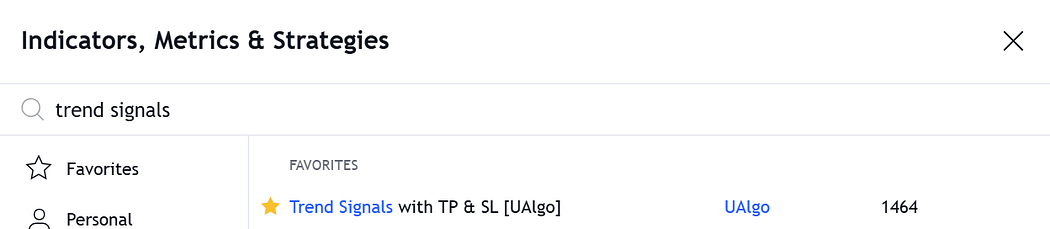
- Open TradingView and click on Indicators.
- Search for “Trend Signal with TP and SL” and add it to your chart.
- Go to the settings and adjust:
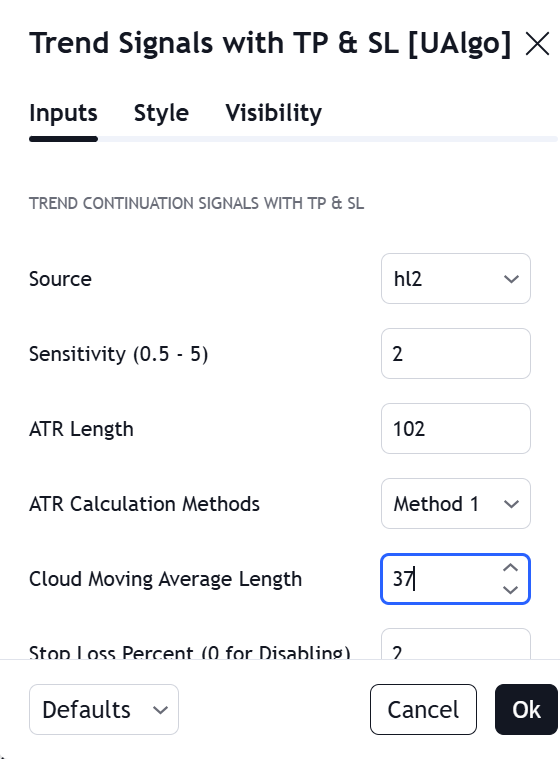
- ATR Length: Change from 14 to 102.
- Cloud Moving Average Length: Change from 10 to 37.
- In the Style tab, hide any unnecessary options to keep the chart clean.
2. Add Floor Pivots with Camerilla Levels
- Click on Indicators again and search for “Floor Pivots.”
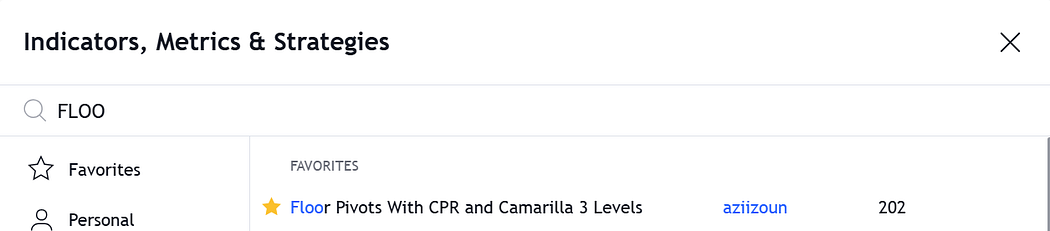
- Add an indicator with Camarilla Pivot levels to the chart for dynamic support and resistance zones.
- Adjust the settings to ensure that the levels are clear and visible on your chart.
Understanding the Indicators
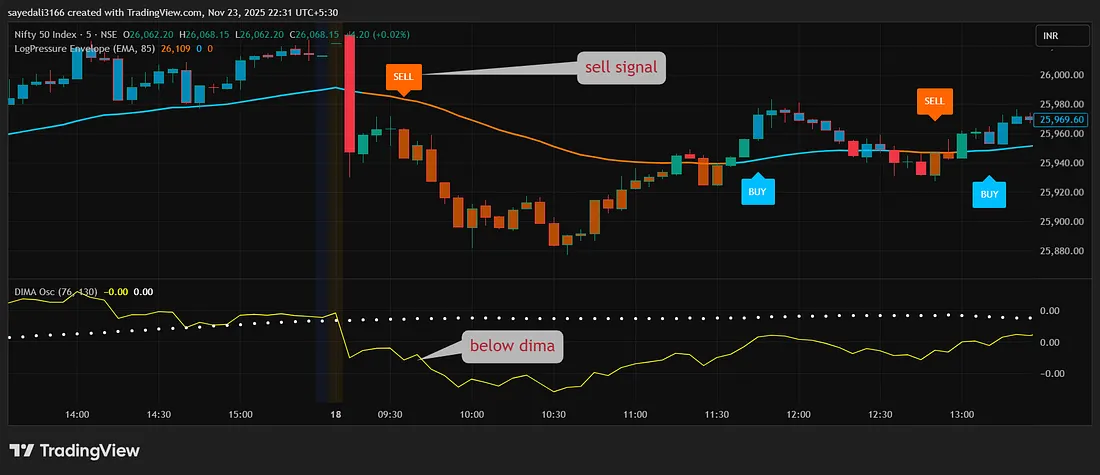
Trend Signal with TP and SL
This indicator is built to identify trend shifts, providing buy and sell signals based on trend color changes:
- Green indicates a buy signal and a potential uptrend.
- Red indicates a sell signal and a potential downtrend.
Floor Pivots with Camerilla Levels
The Floor Pivots with Camarilla Levels indicator offers essential support and resistance levels:
- Camarilla S3 and S4 levels mark strong support zones where prices could rebound.
- Camarilla R3 and R4 levels are resistance zones where prices may face selling pressure. Using these levels can help you gauge market direction and validate buy/sell signals based on price movement relative to the pivot levels.
Trading Strategy Rules
Buy Signal Criteria
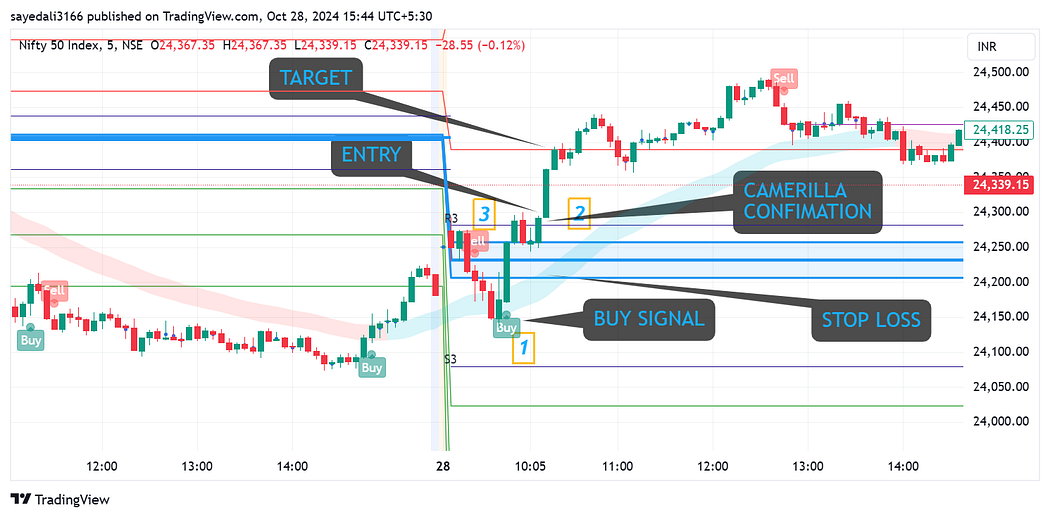
- Confirm the Buy Signal
- Check if the Trend Signal indicator shows a buy signal (green color).
2. Verify the Camerilla Level Support
- Ensure that the market price is trading above a key Camarilla resistance level (like R3 &R4 or S3 &S4) to confirm bullish conditions.
3. Entry Point
- Enter a long position when the above conditions are met, ideally on the close of a bullish candle above Resistance.
4. Set Stop Loss
- Place your stop loss just below the Camerilla support level (e.g., S3 or S4) to manage risk.
5. Take Profit
- Target a 1.5:1 risk-reward ratio, or set your take profit at the nearest resistance level (R3 or R4).
Sell Signal Criteria
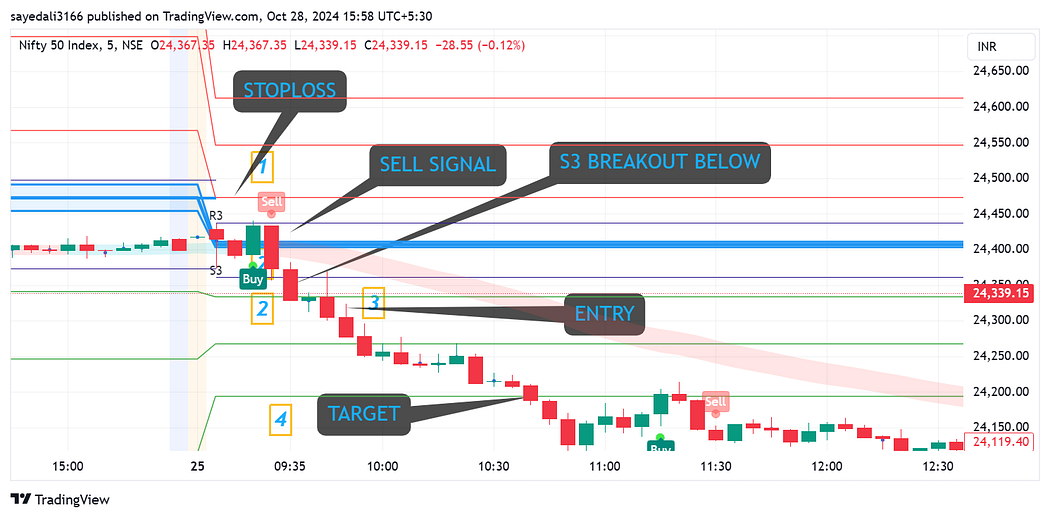
- Confirm the Sell Signal
- Check if the Trend Signal indicator shows a sell signal (red color).
2. Verify the Camerilla Level Resistance
- Ensure the market price is trading below a key Camarilla resistance level (like R3 or R4) to confirm bearish conditions.
3. Entry Point
- Enter a short position when the above conditions are met, ideally on the close of a bearish candle below resistance.
4. Set Stop Loss
- Place your stop loss just above the Camarilla resistance level (e.g., R3 or R4).
5. Take Profit
- Target a 1.5:1 risk-reward ratio, or set your take profit at the nearest support level (S3 or S4).
Time Frame and Trade Management
For this strategy, the 5-minute chart works well, providing a balanced distance between stop loss and take profit.
Avoiding False Signals
While this strategy is robust, false signals are always a possibility. To reduce them:
Wait for Signal Confirmation: Confirm buy/sell signals by looking at the ribbon color. Buy entry should be in green ribbon and sell entry should be in red ribbon.
Consistency in Timeframes: Make sure all indicators are set to the same timeframe.
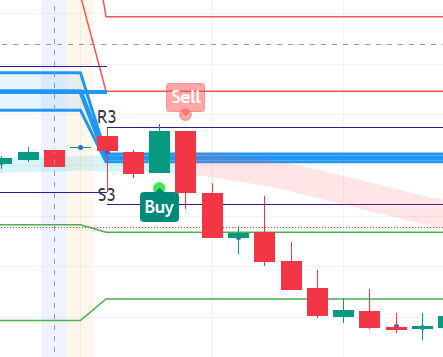
Breakout Confirmation: Confirm with R3 or s3 breakout. The candle should be crossed and closed above for buy entry and below for sell entry R3 and S3 respectively.
Risk Adjustments: If conflicting signals arise, consider tightening your stop loss or reducing position size.
With these steps, you’re ready to implement this strategic combination of Trend Signal with TP and SL, and Floor Pivots with Camerilla Levels. This setup combines trend-following with pivot-based support and resistance to help you capture high-probability trades.
Happy Trading!