
Trendlines in trading
Do you know how to draw a trendline? If not Don’t worry it’s simple with the help of an indicator. You spend hours analyzing charts, drawing lines, and waiting for that perfect breakout — only to watch the price reverse and stop you. Manually drawing trend lines is subjective. What looks like a valid trend line to one trader might look completely different to another.
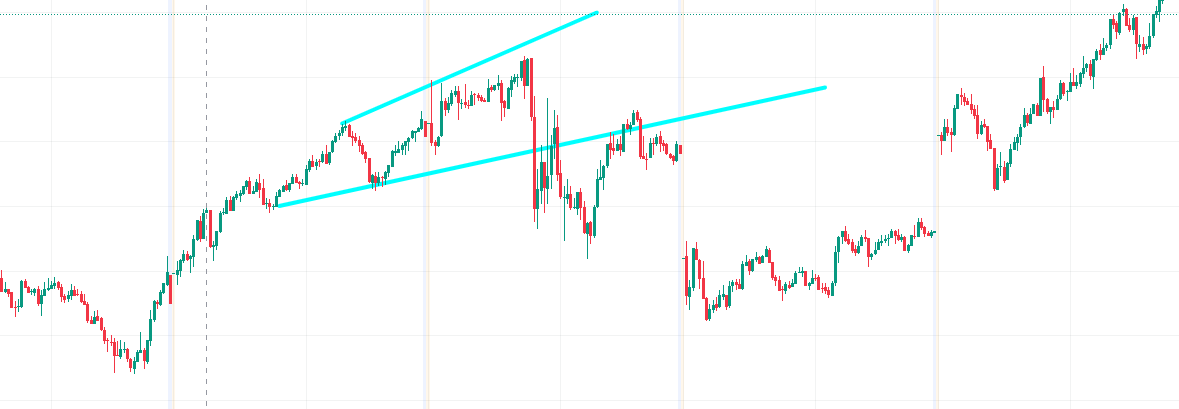
But what if there was a better way? What if you could take the guesswork out of trading and let technology do the heavy lifting for you?
Yes it is possible
Let’s get into the strategy.
Ready to transform your financial future and dominate the stock market? Whether you’re a beginner looking to take your first steps or a trader hungry for proven strategies, I’ve got you covered!
📘 ‘Stock Market for Beginners’ is your ultimate guide to understanding the market from scratch. Learn essential terms, beginner-friendly strategies, and how to start growing your wealth — no experience needed!
📗 ’25 Intraday Strategies in 2025′ is packed with powerful, easy-to-follow setups designed to maximize your trading profits this year. From quick scalps to trend-following techniques, this book gives you the edge to crush the markets like a pro.
🚀 Don’t miss this opportunity to supercharge your financial journey. Get both ebooks now on Gumroad and start building your path to success today!
How to add the indicators
Step 1: Open TradingView
- Go to TradingView and log in to your account.
Step 2: Open a Chart
- Click on Chart at the top of the page to open a new chart.
- Choose the trading pair or instrument you want to analyze (e.g., BTC/USD, EUR/USD, or a stock).
Step 3: Search for the Indicator
- On the chart, look for the Indicators button at the top of the screen. It’s labeled fx and is usually located next to the symbol search bar.
- Click on it to open the Indicators & Strategies window.
Step 4: Find the Trend Lines Breakouts with targets Indicator
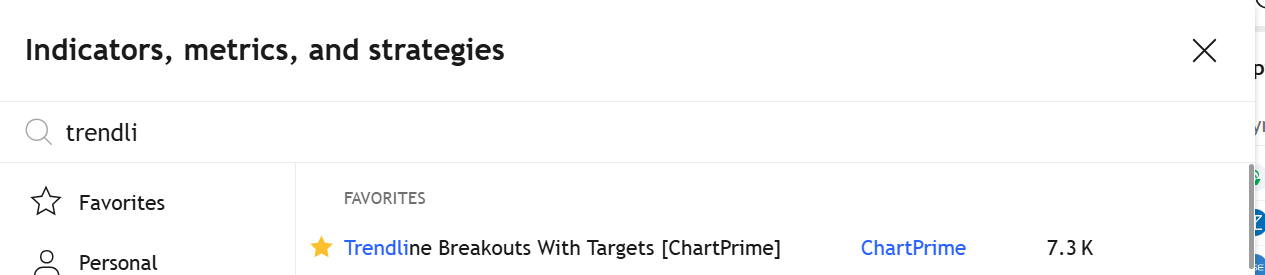
- In the search bar of the Indicators & Strategies window, type “Trend Lines Breakouts with targets”.
- Look for the indicator in the search results. It should appear as one of the options.
- Click on the indicator to add it to your chart.
Buy conditions
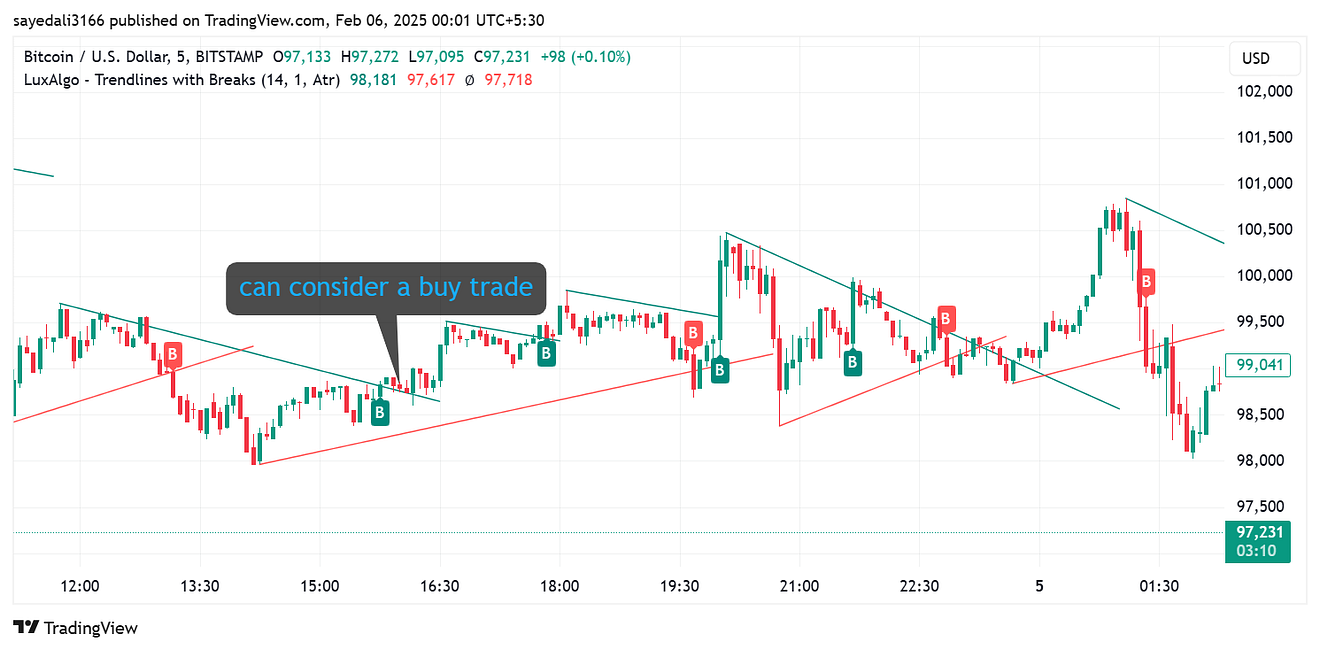
- The Trend Lines Breakouts with targets indicator draw a trend line.
- Price breaks above the trend line (bullish breakout).
Entry:
- Enter a buy position when the price closes above the trend line after the breakout.
Stop Loss:
- Place the stop loss below the recent swing low.
Take Profit:
- Use a 1:2 risk-reward ratio
- Alternatively, set the take profit at the next key resistance level.
Sell conditions
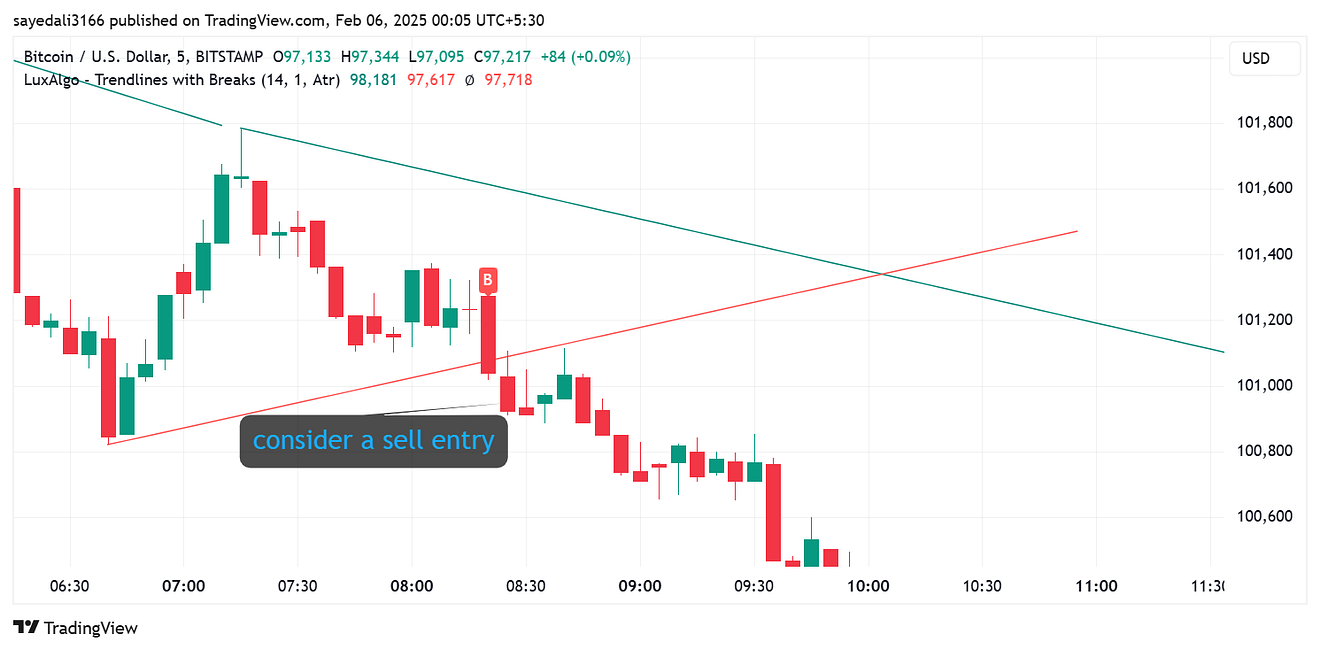
- The Pivot Trend Lines with Breakouts indicator draws a trend line.
- Price breaks below the trend line (bearish breakout).
Entry:
- Enter a sell position when the price closes below the trend line after the breakout.
Stop Loss:
- Place the stop loss above the recent swing high
Take Profit:
- Use a 1:2 risk-reward ratio
- Alternatively, set the take profit at the next key support level.
Key Rules to Follow
- Trade with the Trend: Only take buy signals in an uptrend and sell signals in a downtrend. Avoid trading against the trend.
- Wait for Confirmation: Don’t act on the breakout until the price closes above or below the trend line.
- Manage Risk: Always use a stop loss and aim for a favorable risk-reward ratio.
- Avoid Overloading: Stick to one or two indicators.
By following these buy and sell conditions, you’ll have a clear, rules-based approach to trading breakouts with confidence. Always remember to backtest the strategy on historical data and practice on a demo account before trading with real money.
You can read more strategies below: