Now Intraday trading is popular among the people. Many technical indicators are available for intraday trading. Some people use price action-based trading while others use technical indicators to confirm their trade and few use both methods of trading. Whatever method they use, trading is risky. The only thing we can do to survive in the stock market is to minimize the loss.
Ready to transform your financial future and dominate the stock market? Whether you’re a beginner looking to take your first steps or a trader hungry for proven strategies, I’ve got you covered!
📘 ‘Stock Market for Beginners’ is your ultimate guide to understanding the market from scratch. Learn essential terms, beginner-friendly strategies, and how to start growing your wealth — no experience needed!
📗 ’25 Intraday Strategies in 2025′ is packed with powerful, easy-to-follow setups designed to maximize your trading profits this year. From quick scalps to trend-following techniques, this book gives you the edge to crush the markets like a pro.
🚀 Don’t miss this opportunity to supercharge your financial journey. Get both ebooks now on Gumroad and start building your path to success today!
In this article, I will explain an indicator that is less popular among traders.
Central Pivot Range
The Central Pivot Range is a leading indicator you can use while trading. It’s one of my personal favorite technical indicators. Most of the Trades are with the help of this indicator. You can deploy different strategies using this single indicator. This is a leading indicator that’s why I like this indicator. Because this indicator gives an early signal before trend changes. If you are using a moving average indicator, it only shows a signal after the trend changes. Capturing early signals is an advantage in trading.
Let’s dive into more details of this indicator.
Understanding the Central Pivot Range (CPR)
CPR consists of three primary levels which are derived from the previous trading day’s price data:
Pivot Point (P): This central level is calculated as the average of the previous day’s high (H), low (L), and close (C) prices:
P=(H+L+C)/3P = (H + L + C) / 3P=(H+L+C)/3
Bottom Central Pivot (BC): This is the average of the previous day’s high and low prices:
BC=(H+L)/2BC = (H + L) / 2BC=(H+L)/2
Top Central Pivot (TC): This level is determined by subtracting the BC from the Pivot Point and adding the result to the Pivot Point:
TC=P+(P−BC)TC = P + (P – BC)TC=P+(P−BC)
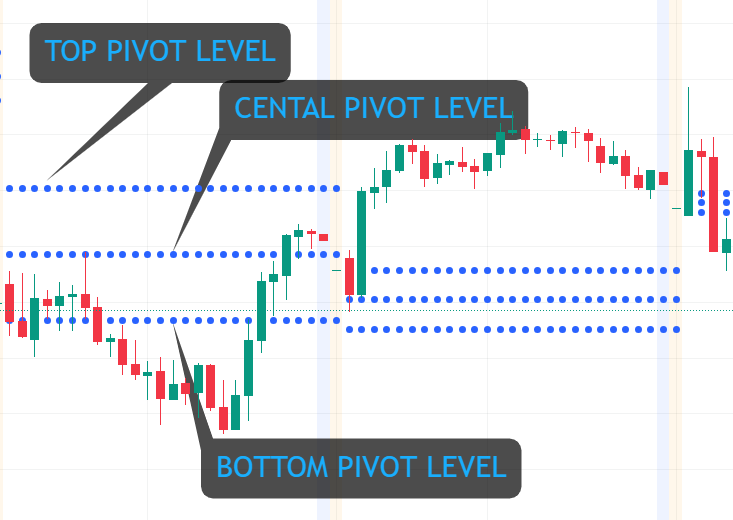
These three levels together called as Central Pivot Range.
Interpretation of CPR
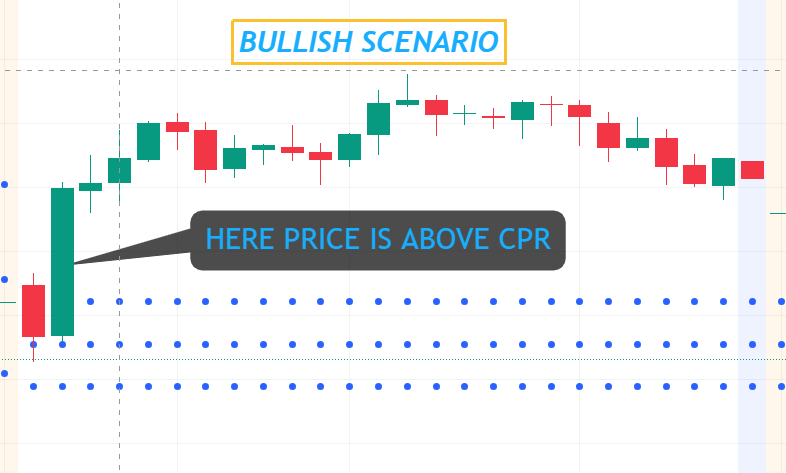
You can look for three scenarios with CPR
- Bullish Scenario: If the current trading price is above the TC, it suggests a bullish sentiment, indicating potential upward movement.
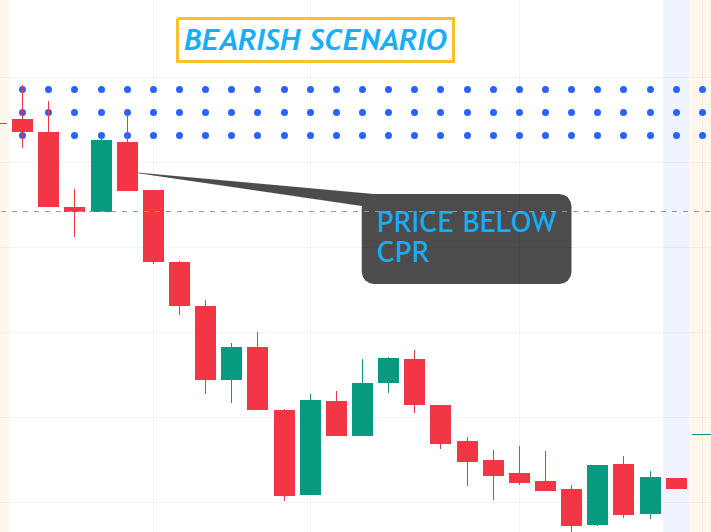
- Bearish Scenario: Conversely, if the price is below the BC, it indicates a bearish sentiment, suggesting potential downward movement.
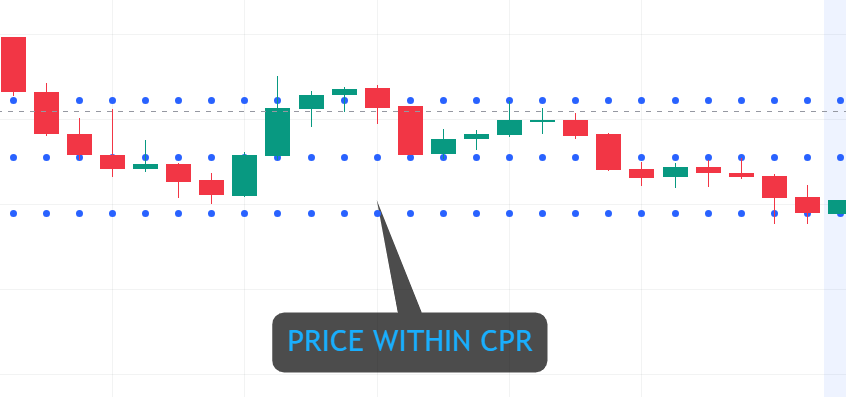
- Sideways or Range-Bound Market: When the price oscillates between the TC and BC, it may indicate a consolidating market with no clear directional bias.
In addition, you can choose the narrow CPR and wide CPR concept.
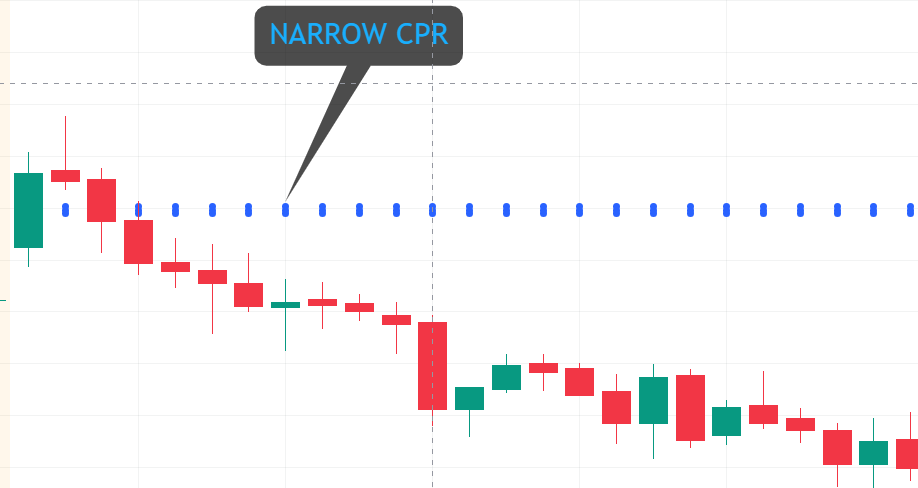
- Narrow CPR: A narrow range between the TC and BC often indicates low volatility and the potential for a significant price movement or breakout.
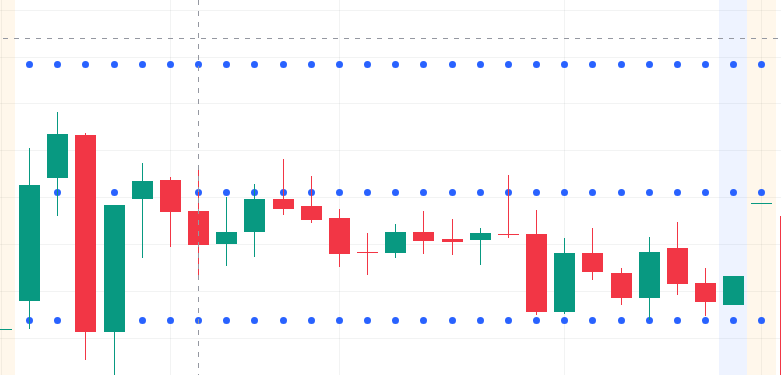
- Wide CPR: A wider range suggests higher volatility, indicating that the market may experience choppy price action with no clear direction.
What should look for?
If you can see a narrow CPR at the beginning of the market you set your trade based on that and if you can see a wide CPR it tells you that today the market may be consolidated.
How to add the CPR indicator?
I am using tradingview platform for my trade anlysis. Adding the Central Pivot Range (CPR) indicator on TradingView is a straightforward process. Here’s the step-by-step guide to get you started:
- Open TradingView:
- Log in to your TradingView account or create a free account if you don’t have one.
- Select a Chart:
- Choose the instrument you want to analyze (e.g., stocks, forex, or cryptocurrency).
- Open the chart by typing the symbol of the instrument in the search bar at the top.
- Access the Indicators Menu:
- Click on the “Indicators” button located at the top of the chart (looks like a stack of small bars).
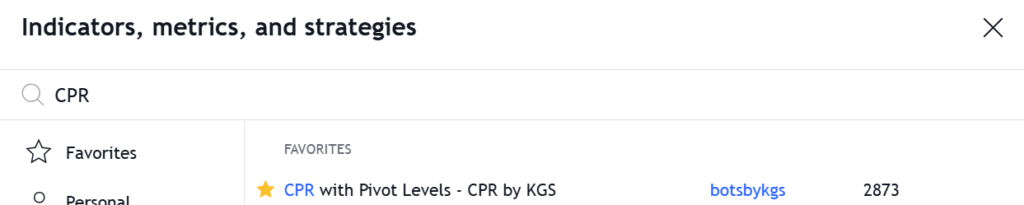
- Search for the CPR Indicator:
- In the search bar within the Indicators menu, type “CPR”, “Pivot Points”, or “Central Pivot Range”.
- Custom CPR indicators uploaded by TradingView community members. These are often named as “CPR by [author]” or similar.
5. Add the Indicator:
- Click on the desired indicator from the search results to add it to your chart. It will automatically plot on your chart.
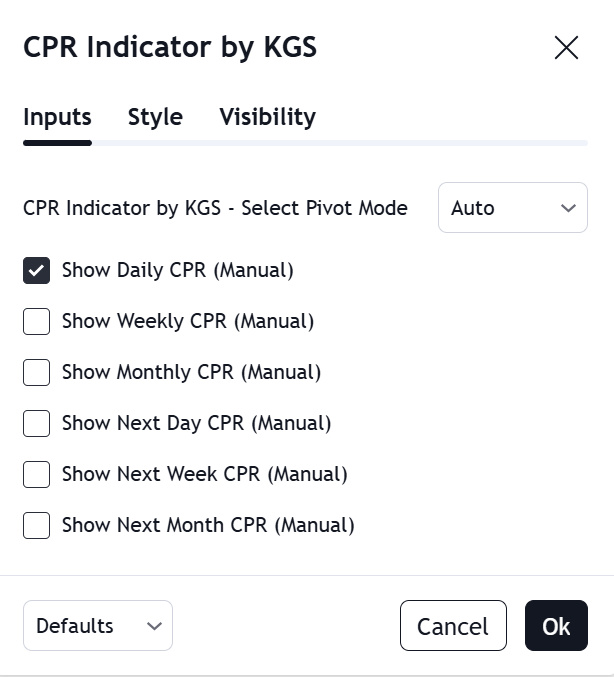
6. Customize the Settings (Optional):
- Hover over the indicator on the chart and click the settings (gear icon).
- Customize parameters for more clarity
7. Save the Chart (Optional):
- After adding and customizing the indicator, click on the Save button at the top to retain the settings for future use.
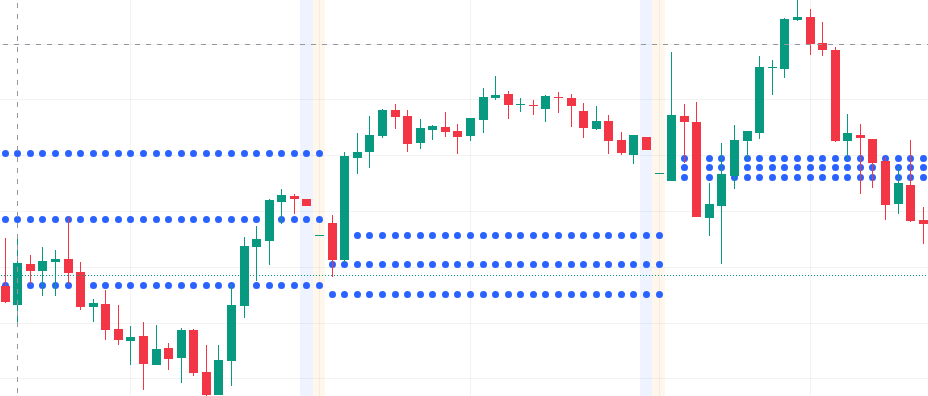
With the above CPR by KGS, you can opt for monthly CPR, or weekly CPR like that.
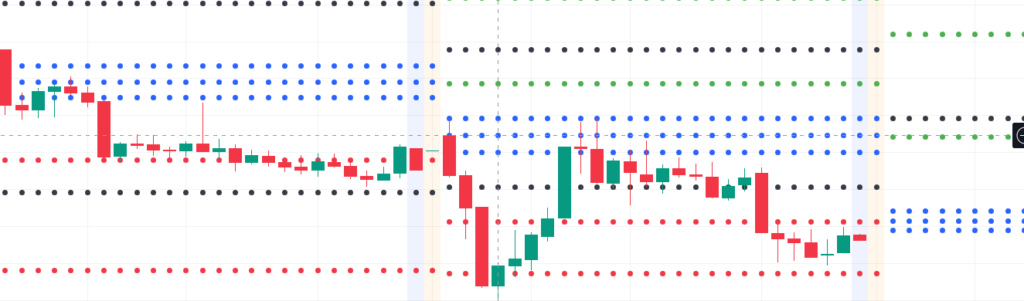
You may get the above image after applying the indicator. The red lines are the support line and the green lines are the resistance line.
CPR vs. Lagging Indicators
| Feature | CPR (Leading Indicator) | Moving Averages, RSI, MACD (Lagging Indicators) |
| Purpose | Predicts key price levels | Confirms trends after they occur |
| Data Source | Previous day’s high, low, and close | Historical price data and live price movements |
| Reactivity | Static levels for the day | Continuously updates based on price action |
| Planning | Used for pre-market strategies | Used for mid-session adjustments |
Limitations of CPR
While CPR is a valuable tool, it’s essential to be aware of its limitations:
- Not Foolproof: Like all indicators, CPR is not infallible. False signals can occur, especially in highly volatile or news-driven markets.
- Requires Confirmation: It’s advisable to use CPR in conjunction with other indicators or analysis methods to confirm potential trade setups.
- Limited to Intraday Trading: CPR is primarily designed for intraday trading and may not be as effective for longer-term analyses.
Conclusion
The Central Pivot Range is a powerful and versatile tool in technical analysis, offering traders valuable insights into potential support and resistance levels. Its simplicity and leading nature make it particularly useful for intraday traders seeking to navigate the complexities of the financial markets.